More complex modeling
Análisis de datos de encuestas en R

Kelly McConville
Assistant Professor of Statistics
Multiple linear regression
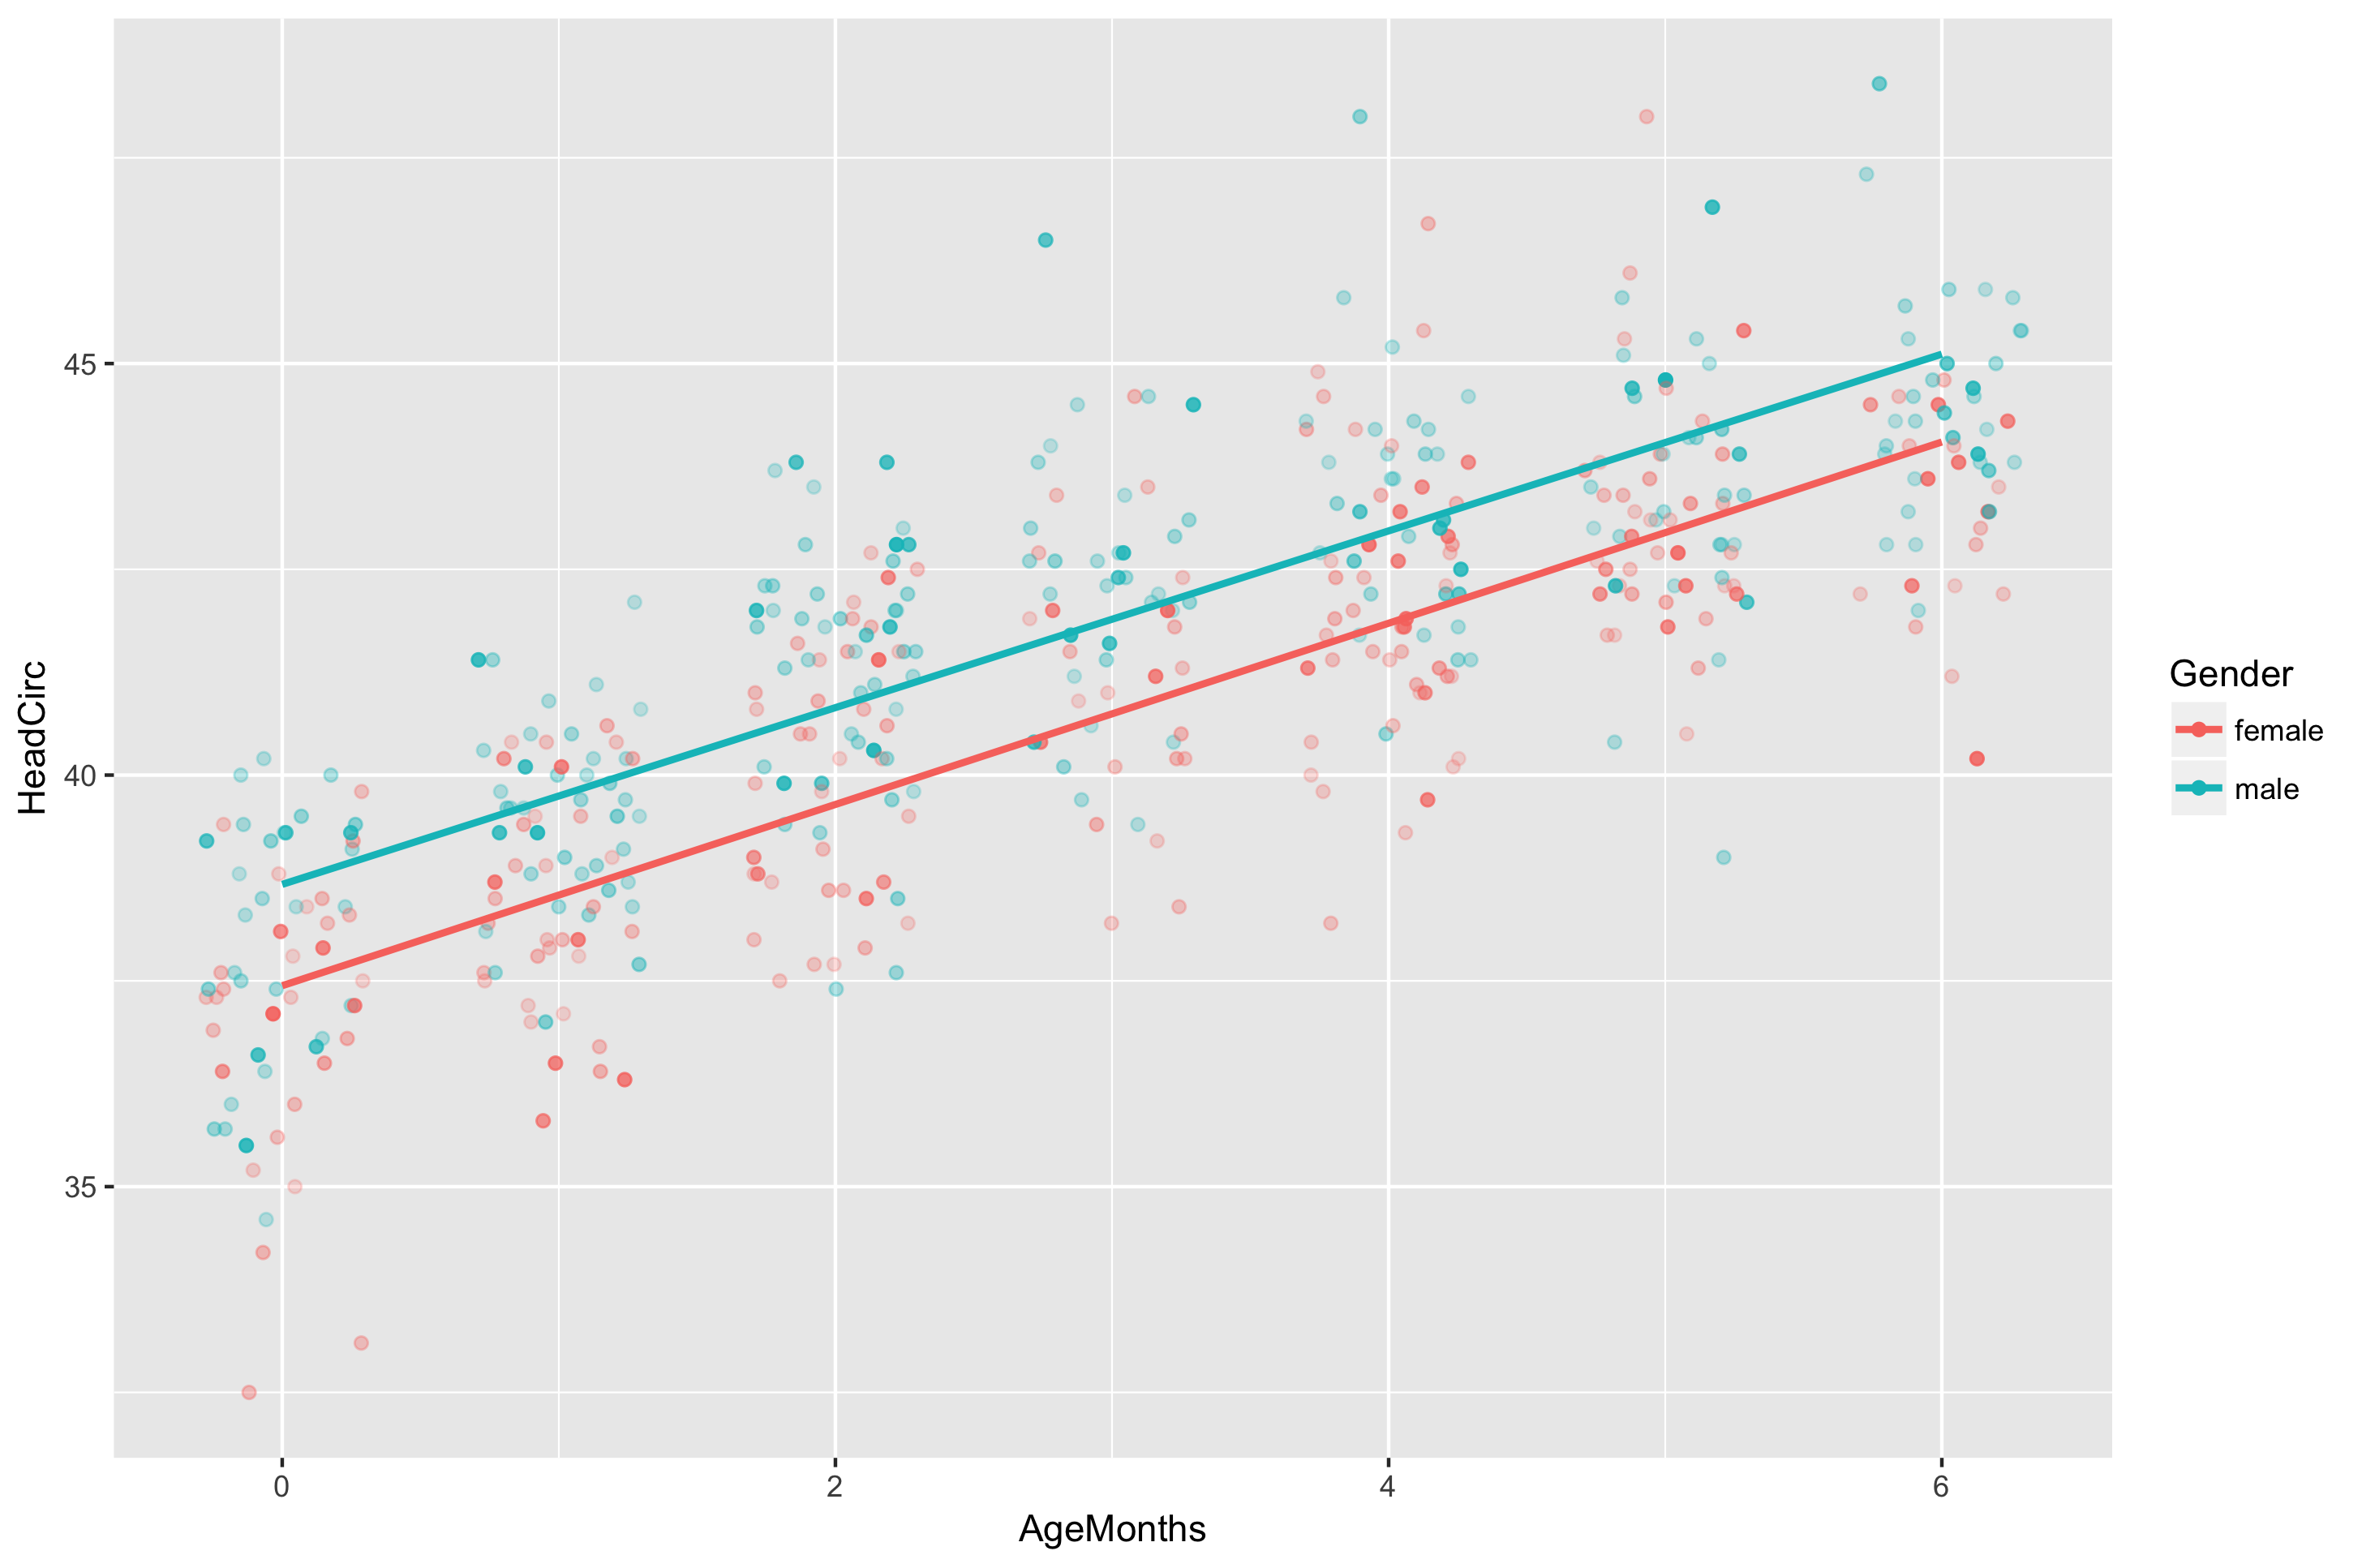
Multiple linear regression
- Multiple linear regression equation is given by:
$$E(y) = B_0 + B_1 x_1 + B_2x_2 + \ldots + B_p x_p$$
babies
# A tibble: 484 x 4
   AgeMonths HeadCirc WTMEC4YR Gender
       <int>    <dbl>    <dbl> <fct>
 1         3     42.7   12915. male
 2         4     42.8   12791. female
 3         2     38.8    2359. female
 4         0     36.0    4306. female
 5         5     42.7    2922. female
 6         2     41.9    5561. male
 7         6     44.3   10416. female
# ... with 477 more rows
Multiple linear regression
- Multiple linear regression equation is given by:
$$E(y) = B_0 + B_1 x_1 + B_2x_2$$
babies
# A tibble: 484 x 4
   AgeMonths HeadCirc WTMEC4YR Gender
       <int>    <dbl>    <dbl> <fct>
 1         3     42.7   12915. male
 2         4     42.8   12791. female
 3         2     38.8    2359. female
 4         0     36.0    4306. female
 5         5     42.7    2922. female
 6         2     41.9    5561. male
 7         6     44.3   10416. female
# ... with 477 more rows
Multiple linear regression
babies <- mutate(babies, Gender2 = case_when(
  Gender == "male" ~ 1,
  Gender == "female" ~ 0))
babies
# A tibble: 484 x 5
   AgeMonths HeadCirc WTMEC4YR Gender Gender2
       <int>    <dbl>    <dbl> <fct>    <dbl>
 1         3     42.7   12915. male        1.
 2         4     42.8   12791. female      0.
 3         2     38.8    2359. female      0.
 4         0     36.0    4306. female      0.
 5         5     42.7    2922. female      0.
 6         2     41.9    5561. male        1.
 7         6     44.3   10416. female      0.
# ... with 477 more rows
Multiple linear regression
- Multiple linear regression equation is given by:
$$E(y) = B_0 + B_1 x_1 + B_2x_2$$
- Line for males:
$$E(y) = (B_0 + B_2) + B_1 x_1$$
- Line for females:
$$E(y) = B_0 + B_1 x_1$$
Multiple linear regression
mod <- svyglm(HeadCirc ~ AgeMonths + Gender, design = NHANES_design)
summary(mod)
svyglm(formula = HeadCirc ~ AgeMonths + Gender, design = NHANES_design)

Survey design:
svydesign(data = NHANESraw, strata = ~SDMVSTRA, id = ~SDMVPSU,
    nest = TRUE, weights = ~WTMEC4YR)

Coefficients:
            Estimate Std. Error t value Pr(>|t|)
(Intercept) 37.48508    0.18320 204.613  < 2e-16 ***
AgeMonths    1.08658    0.05379  20.200  < 2e-16 ***
Gendermale   1.15034    0.16298   7.058  6.3e-08 ***
(Some output omitted)
Multiple linear regression
Coefficients:
            Estimate Std. Error t value Pr(>|t|)
(Intercept) 37.48508    0.18320 204.613  < 2e-16 ***
AgeMonths    1.08658    0.05379  20.200  < 2e-16 ***
Gendermale   1.15034    0.16298   7.058  6.3e-08 ***
(Some output omitted)
Null hypothesis: Given age is in the model, gender should not be included ($B_2 = 0$).
Alternative hypothesis: Given age is in the model, gender should be included ($B_2 \neq 0$).
Test statistic: $t = \frac{b_2}{SE}$
Multiple linear regression
Coefficients:
            Estimate Std. Error t value Pr(>|t|)
(Intercept) 37.48508    0.18320 204.613  < 2e-16 ***
AgeMonths    1.08658    0.05379  20.200  < 2e-16 ***
Gendermale   1.15034    0.16298   7.058  6.3e-08 ***
(Some output omitted)
Null hypothesis: Given gender is in the model, age should not be included ($B_1 = 0$).
Alternative hypothesis: Given gender is in the model, age should be included ($B_1 \neq 0$).
Test statistic: $t = \frac{b_1}{SE}$
Multiple linear regression
$$E(y) = B_0 + B_1 x_1 + B_2x_2$$
Let's practice!
Análisis de datos de encuestas en R

