Checking model assumptions and making predictions

Machine Learning para analítica de marketing en R

Verena Pflieger

Data Scientist at INWT Statistics

Test of PH assumption

testCPH1 <- cox.zph(fitCPH1)
print(testCPH1)
                              rho   chisq        p
gender=Male               0.0317   1.884 1.70e-01
SeniorCitizen=Yes         0.0587   6.507 1.07e-02
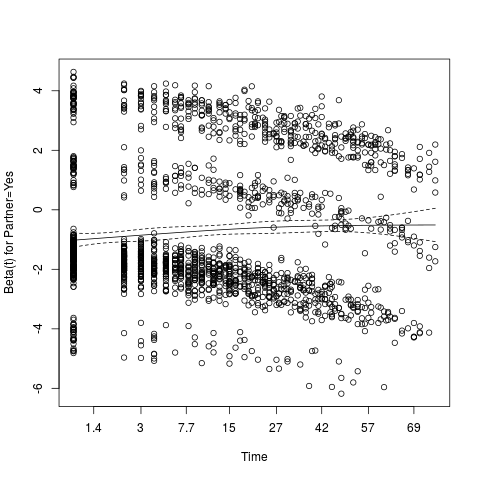
Partner=Yes               0.0752  10.116 1.47e-03
Dependents=Yes            0.0131   0.314 5.75e-01
StreamMov=NoIntServ      -0.0448   3.588 5.82e-02
StreamMov=Yes             0.0827  12.174 4.85e-04
PaperlessBilling=Yes      0.0180   0.611 4.34e-01
PayMeth=CreditCard(auto)  0.0253   1.198 2.74e-01
PayMeth=ElektCheck       -0.0427   3.427 6.41e-02
PayMeth=MailedCheck      -0.0851  13.069 3.00e-04
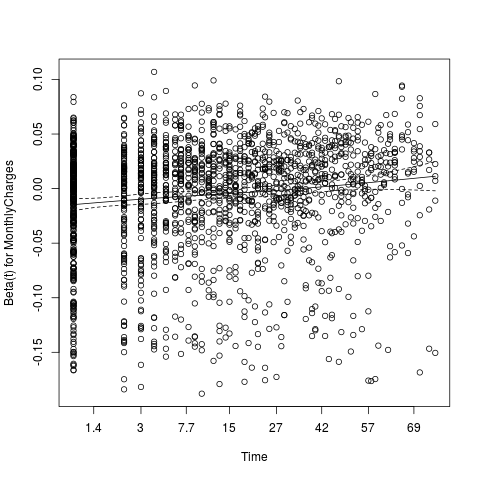
MonthlyCharges            0.1268  25.778 3.83e-07
GLOBAL                        NA 217.172 0.00e+00
Machine Learning para analítica de marketing en R

Proportional hazards for Partner

plot(testCPH1, var = "Partner")
Machine Learning para analítica de marketing en R

Proportional hazards for MonthlyCharges

plot(testCPH1, var = "MonthlyCharges")
Machine Learning para analítica de marketing en R

General remarks on tests

  • cox.zph()-test conservative
  • Sensitive to number of observations
  • Different gravity of violations
Machine Learning para analítica de marketing en R

What if PH assumption is violated?

  • Stratified analysis
fitCPH2 <- cph(Surv(tenure, churn) ~ MonthlyCharges +
                 SeniorCitizen + Partner + Dependents + 
                 StreamMov + Contract,
               stratum = "gender = Male",
               data = dataSurv, x = TRUE, y = TRUE, surv = TRUE)

  • Time-dependent coefficients
Machine Learning para analítica de marketing en R

Validating the model

validate(fitCPH1, 
         method = "crossvalidation", 
         B = 10, pr = FALSE)
      index.orig training   test optimism index.corrected  n
R2        0.2277   0.2279 0.2277   0.0002          0.2276 10
                            ...
Machine Learning para analítica de marketing en R

Probability not to churn at certain timepoint

oneNewData <- data.frame(gender = "Female",
                             SeniorCitizen = "Yes",
                             Partner = "No",
                             Dependents = "Yes",
                             StreamMov = "Yes",
                             PaperlessBilling = "Yes",
                             PayMeth = "BankTrans(auto)",
                             MonthlyCharges = 37.12)
str(survest(fitCPH1, newdata = oneNewData, times = 3))
List of 5
 $ time   : num 3
 $ surv   : num 0.905
 $ std.err: num 0.0136
 $ lower  : num 0.881
 $ upper  : num 0.93
Machine Learning para analítica de marketing en R

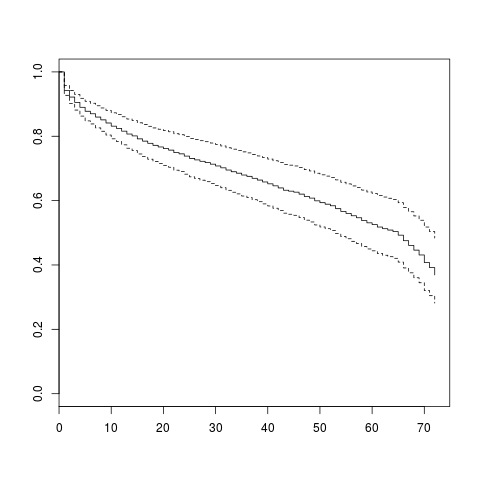
Survival curve for new customer

plot(survfit(fitCPH1, newdata = oneNewData))
Machine Learning para analítica de marketing en R

Predicting expected time until churn

print(survfit(fitCPH1, newdata = oneNewData))
Call: survfit(formula = fitCPH1, newdata = oneNewData)

      n  events  median 0.95LCL 0.95UCL 
   5311    1869      65      53      72 
Machine Learning para analítica de marketing en R

Learnings

Learnings about survival analyis
You have learned... to visualize the tenure times of customers
to model the time to an event and extract factors influencing it
how to validate the model
how to make predictions
Learnings from the model
You have learned... that being senior citizen increases the probability to churn by 23%
that a one-unit increase in monthly charges decreases the hazard of churning by about 1%
Machine Learning para analítica de marketing en R

It is up to you now!

Machine Learning para analítica de marketing en R

Preparing Video For Download...