Plotando um histograma
Pensamento Estatístico em Python (Parte 1)

Justin Bois
Teaching Professor at the California Institute of Technology
Eleições de 2008 nos swing states dos EUA
Dados obtidos em Data.gov (https://www.data.gov/)
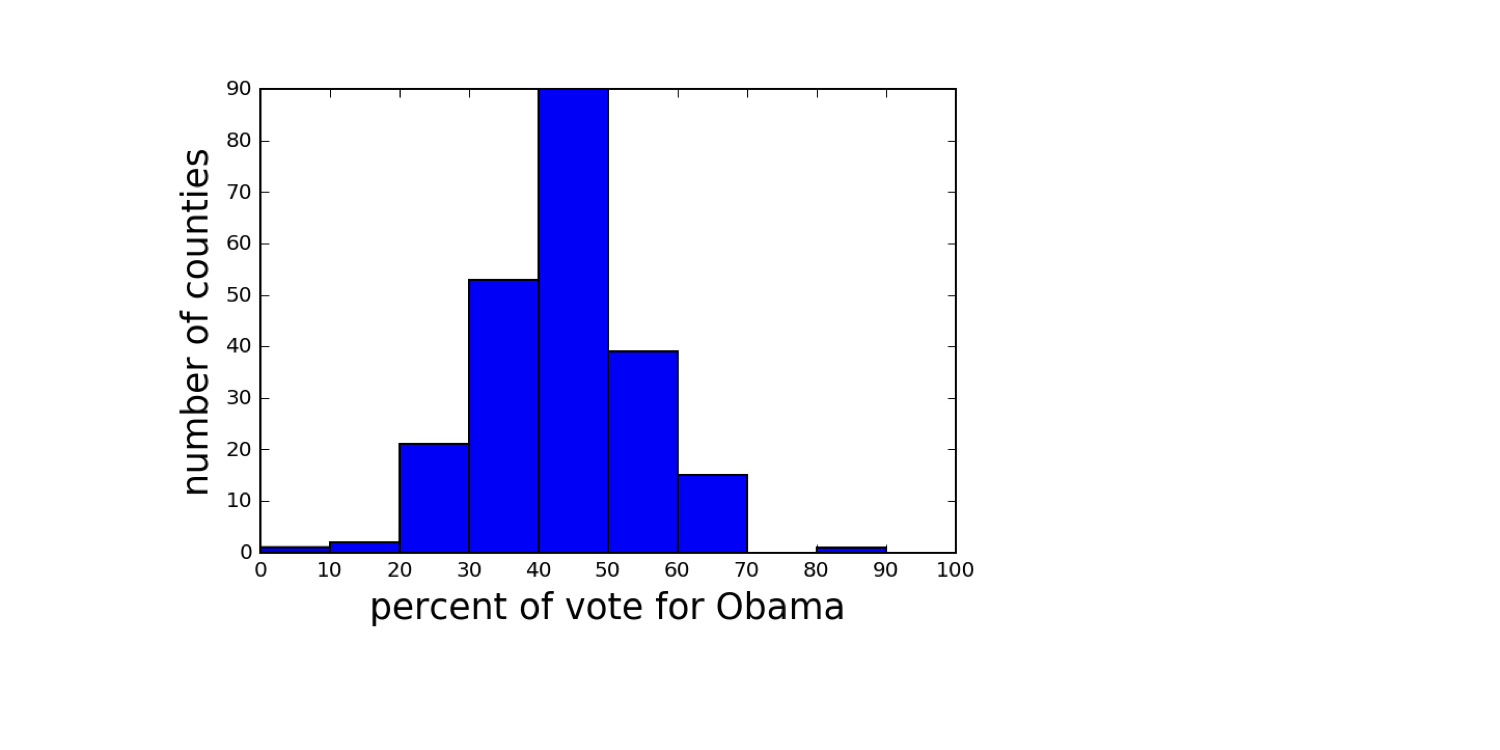
Eleições de 2008 nos swing states dos EUA
Dados obtidos em Data.gov (https://www.data.gov/)
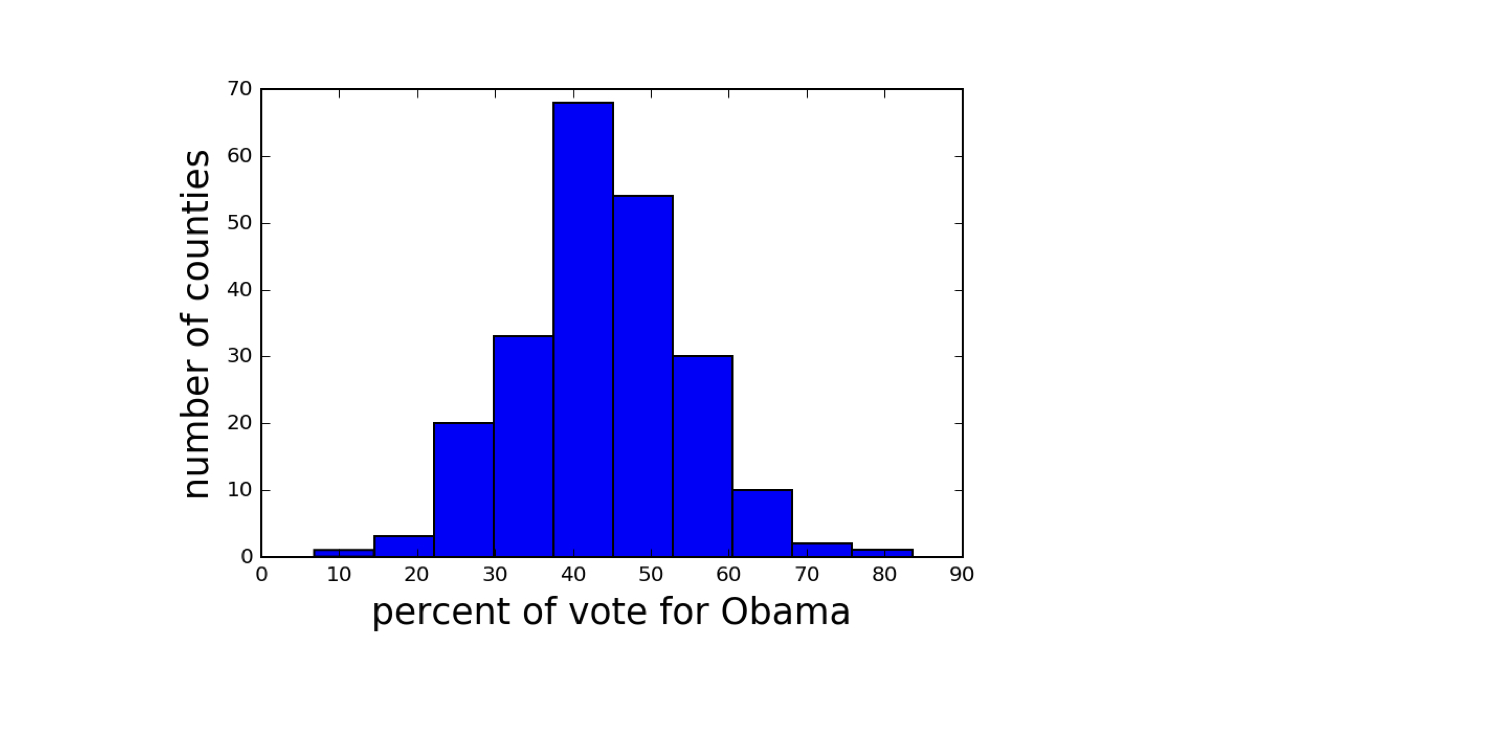
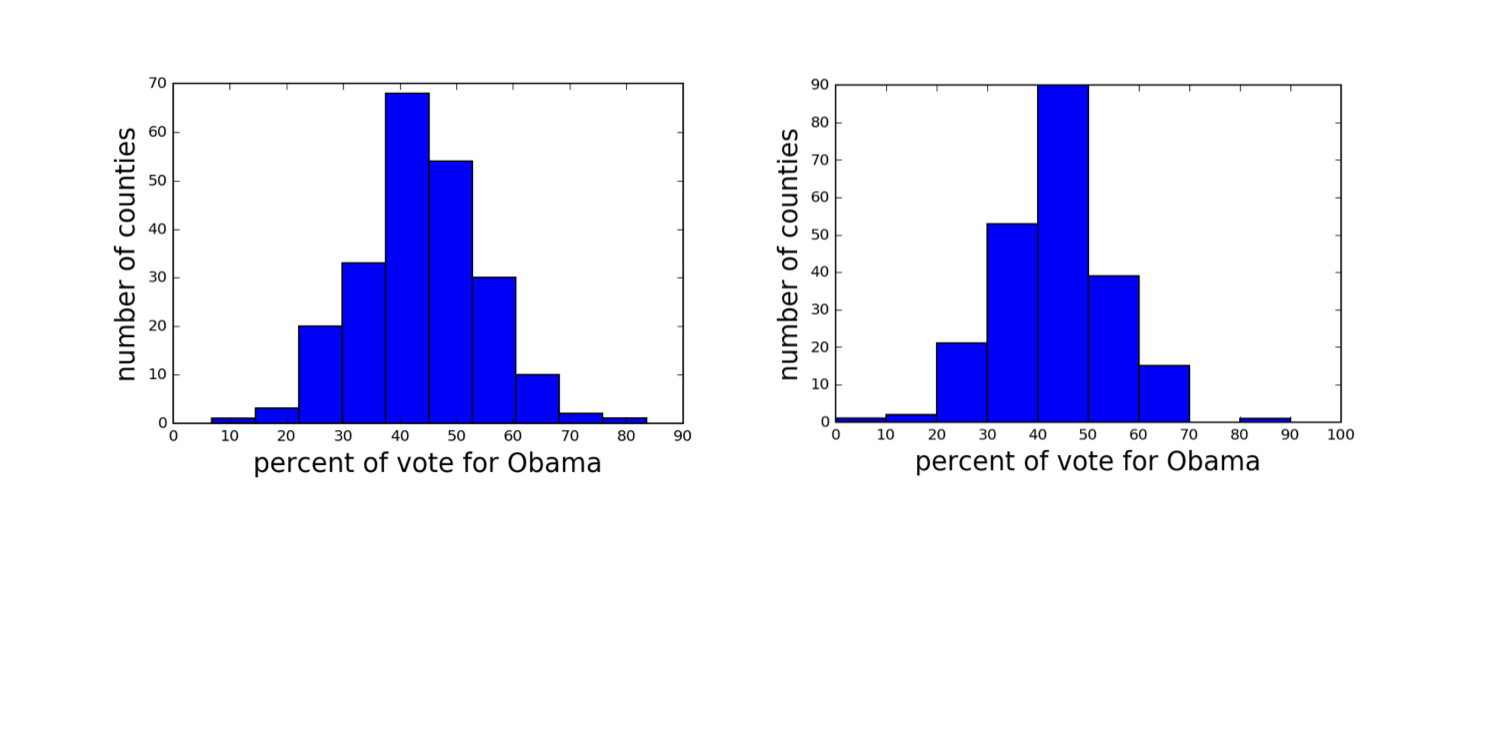
Histogramas com diferentes classes
Dados obtidos em Data.gov (https://www.data.gov/)
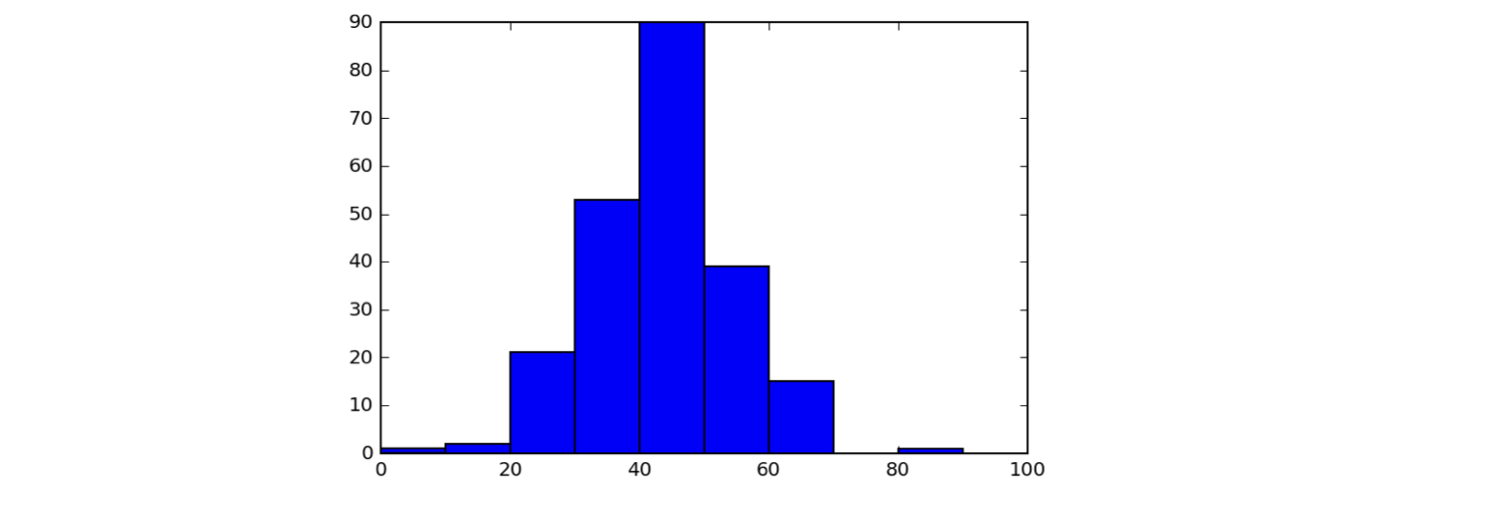
Definindo as classes do histograma
bin_edges = [0, 10, 20, 30, 40, 50,
                60, 70, 80, 90, 100]
_ = plt.hist(df_swing['dem_share'], bins=bin_edges)
plt.show()
Definindo as classes do histograma
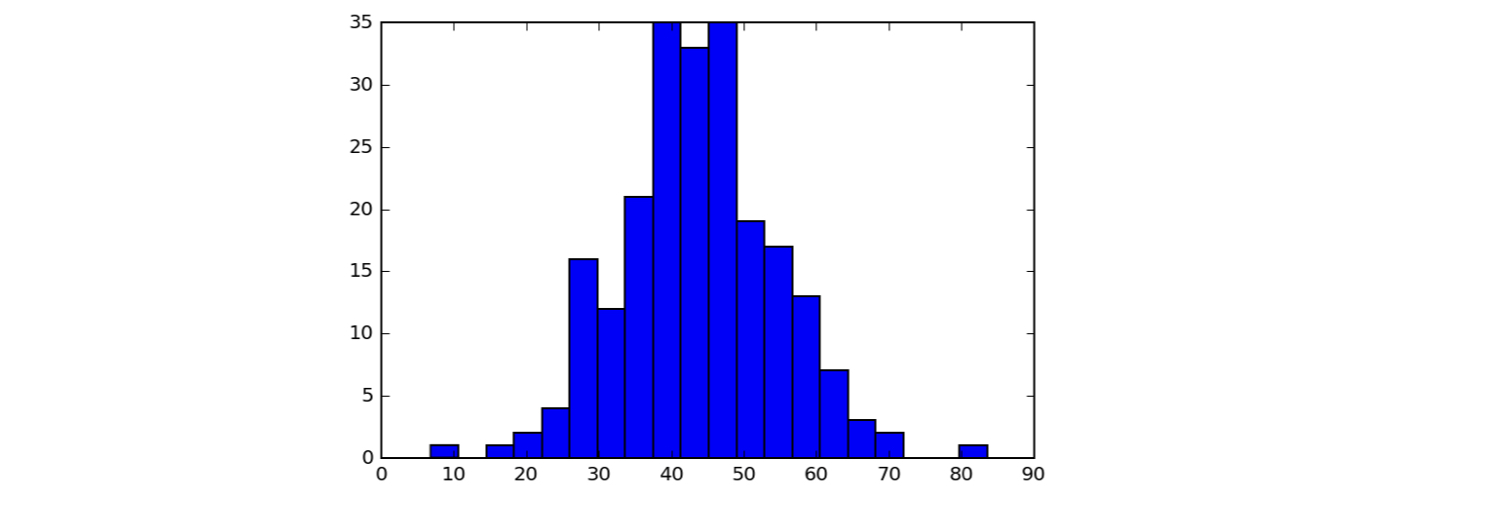
_ = plt.hist(df_swing['dem_share'], bins=20)
plt.show()
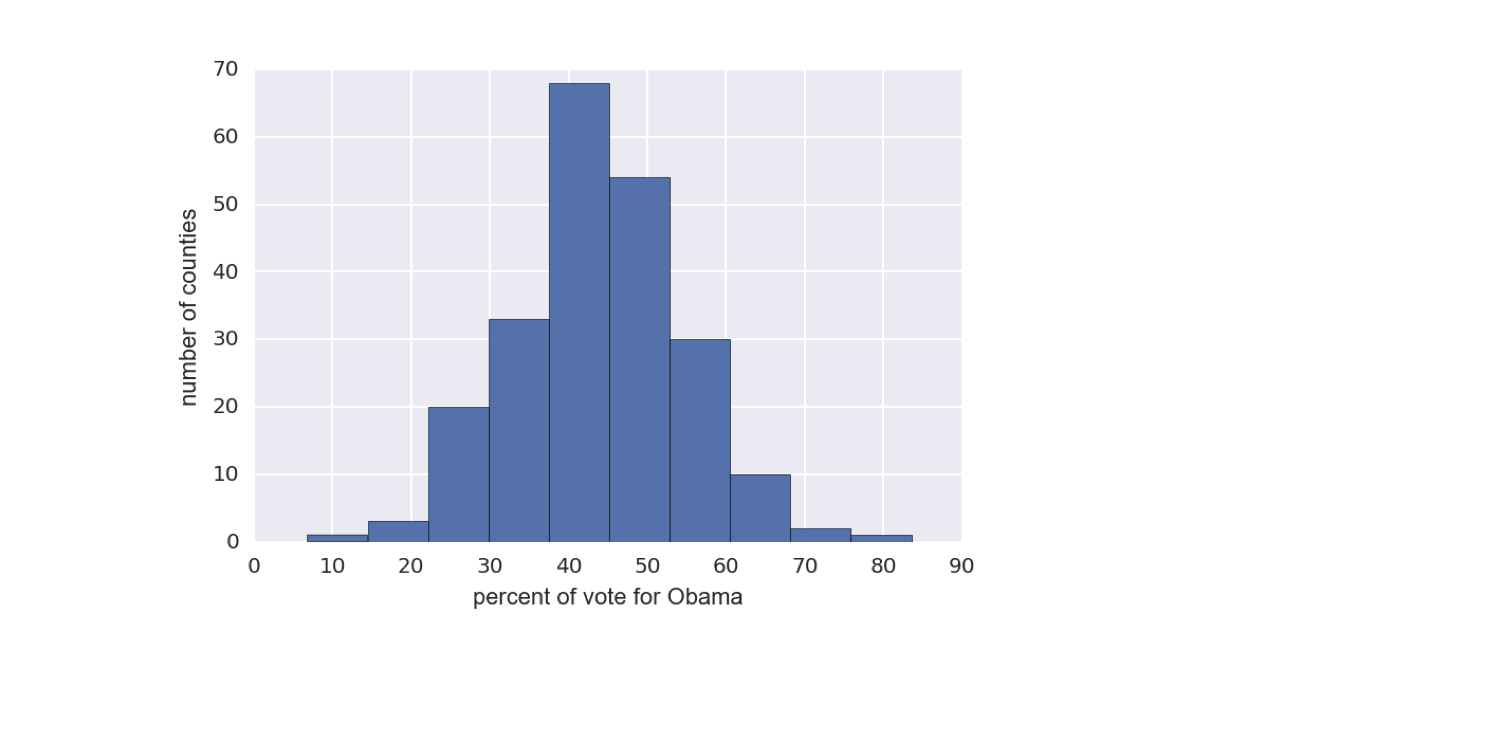
Um histograma com estilo Seaborn
1 Dados obtidos em Data.gov (https://www.data.gov/)

