Encontre relações entre várias séries temporais

Visualizing Time Series Data in Python

Thomas Vincent

Head of Data Science, Getty Images

Correlação entre duas variáveis

  • Em Estatística, o coeficiente de correlação mede a força ou ausência de relação entre duas variáveis:
    • O coeficiente de Pearson é usado quando se supõe relação linear
    • Kendall Tau ou Spearman (ordem) são usados quando se supõe relação não linear
Visualizing Time Series Data in Python

Calcular correlações

from scipy.stats.stats import pearsonr
from scipy.stats.stats import spearmanr
from scipy.stats.stats import kendalltau
x = [1, 2, 4, 7]
y = [1, 3, 4, 8]
pearsonr(x, y)
SpearmanrResult(correlation=0.9843, pvalue=0.01569)
spearmanr(x, y)
SpearmanrResult(correlation=1.0, pvalue=0.0)
kendalltau(x, y)
KendalltauResult(correlation=1.0, pvalue=0.0415)
Visualizing Time Series Data in Python

O que é uma matriz de correlação?

  • Ao calcular o coeficiente de correlação entre mais de duas variáveis, você obtém uma matriz de correlação
    • Intervalo: [-1, 1]
    • 0: sem relação
    • 1: relação positiva forte
    • -1: relação negativa forte
Visualizing Time Series Data in Python

O que é uma matriz de correlação?

  • Uma matriz de correlação é sempre "simétrica"
  • Os valores da diagonal são sempre iguais a 1
   x     y     z
x  1.00 -0.46  0.49
y -0.46  1.00 -0.61
z  0.49 -0.61  1.00
Visualizing Time Series Data in Python

Calculando matrizes de correlação com pandas

corr_p = meat[['beef', 'veal','turkey']].corr(method='pearson')
print(corr_p)
          beef     veal     turkey
beef      1.000   -0.829    0.738
veal     -0.829    1.000   -0.768
turkey    0.738   -0.768    1.000
corr_s = meat[['beef', 'veal','turkey']].corr(method='spearman')
print(corr_s)
          beef     veal     turkey
beef      1.000   -0.812    0.778
veal     -0.812    1.000   -0.829
turkey    0.778   -0.829    1.000
Visualizing Time Series Data in Python

Calculando matrizes de correlação com pandas

corr_mat = meat.corr(method='pearson')
Visualizing Time Series Data in Python

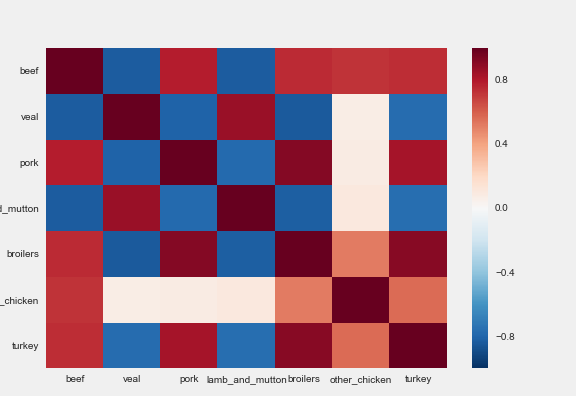
Heatmap

import seaborn as sns

sns.heatmap(corr_mat)
Visualizing Time Series Data in Python

Heatmap

Um heatmap da matriz de correlação

Visualizing Time Series Data in Python

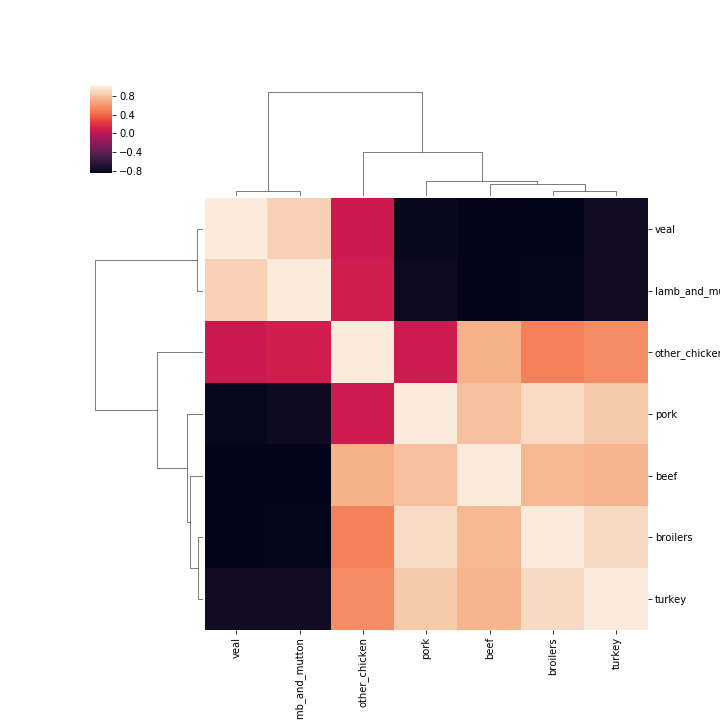
Clustermap

sns.clustermap(corr_mat)
Visualizing Time Series Data in Python

Um clustermap da matriz de correlação

Visualizing Time Series Data in Python

Vamos praticar!

Visualizing Time Series Data in Python

Preparing Video For Download...