As abordagens por drogas estão aumentando?

Analisando a Atividade Policial com pandas

Kevin Markham

Founder, Data School

Reamostrando o preço

apple.groupby(apple.index.month).price.mean()
date_and_time
1    174.34
2    155.78
3    178.46
apple.price.resample('M').mean()
date_and_time
2018-01-31    174.34
2018-02-28    155.78
2018-03-31    178.46
Analisando a Atividade Policial com pandas

Reamostrando o volume

apple
date_and_time         price    volume          
2018-01-08 16:00:00  174.35  20567800
2018-01-09 16:00:00  174.33  21584000
2018-02-08 16:00:00  155.15  54390500
...                     ...       ...
apple.volume.resample('M').mean()
date_and_time
2018-01-31    21075900
2018-02-28    62531550
2018-03-31    27979650
Freq: M, Name: volume, Length: 3, dtype: float64
Analisando a Atividade Policial com pandas

Concatenando preço e volume

monthly_price = apple.price.resample('M').mean()
monthly_volume = apple.volume.resample('M').mean()
pd.concat([monthly_price, monthly_volume], axis='columns')
date_and_time   price    volume
2018-01-31     174.34  21075900
2018-02-28     155.78  62531550
2018-03-31     178.46  27979650
monthly = pd.concat([monthly_price, monthly_volume],
                     axis='columns')
Analisando a Atividade Policial com pandas

Plotando preço e volume (1)

monthly.plot()
plt.show()
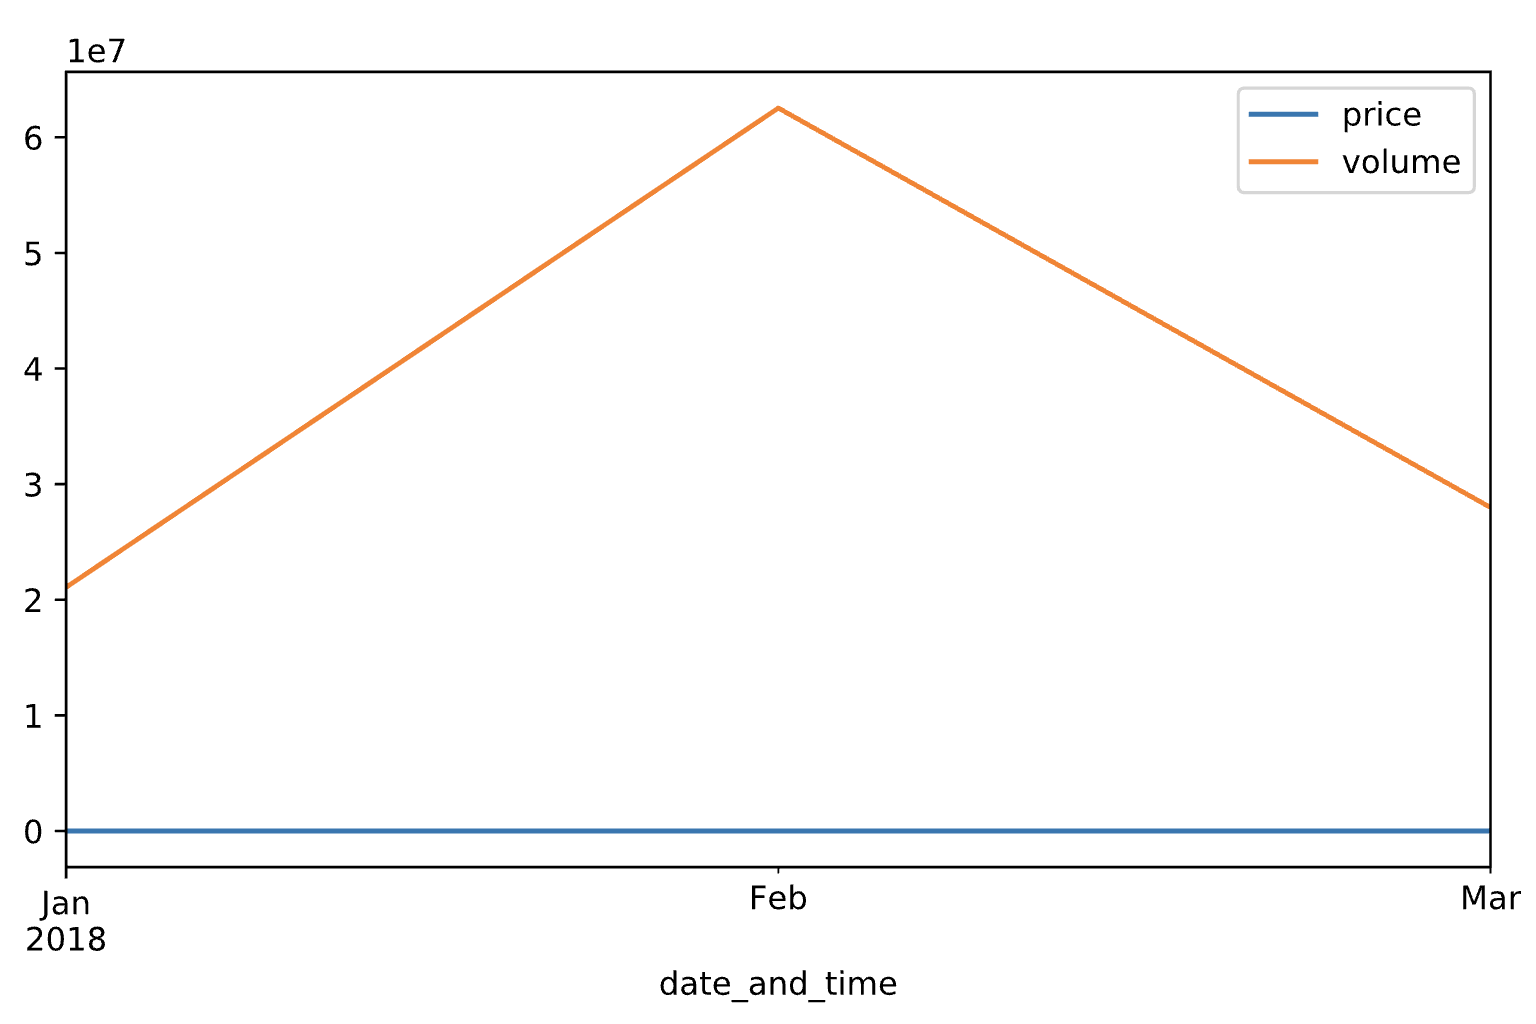
Gráfico de linha único do preço e volume médios mensais da ação da Apple

Analisando a Atividade Policial com pandas

Plotando preço e volume (2)

monthly.plot(subplots=True)
plt.show()
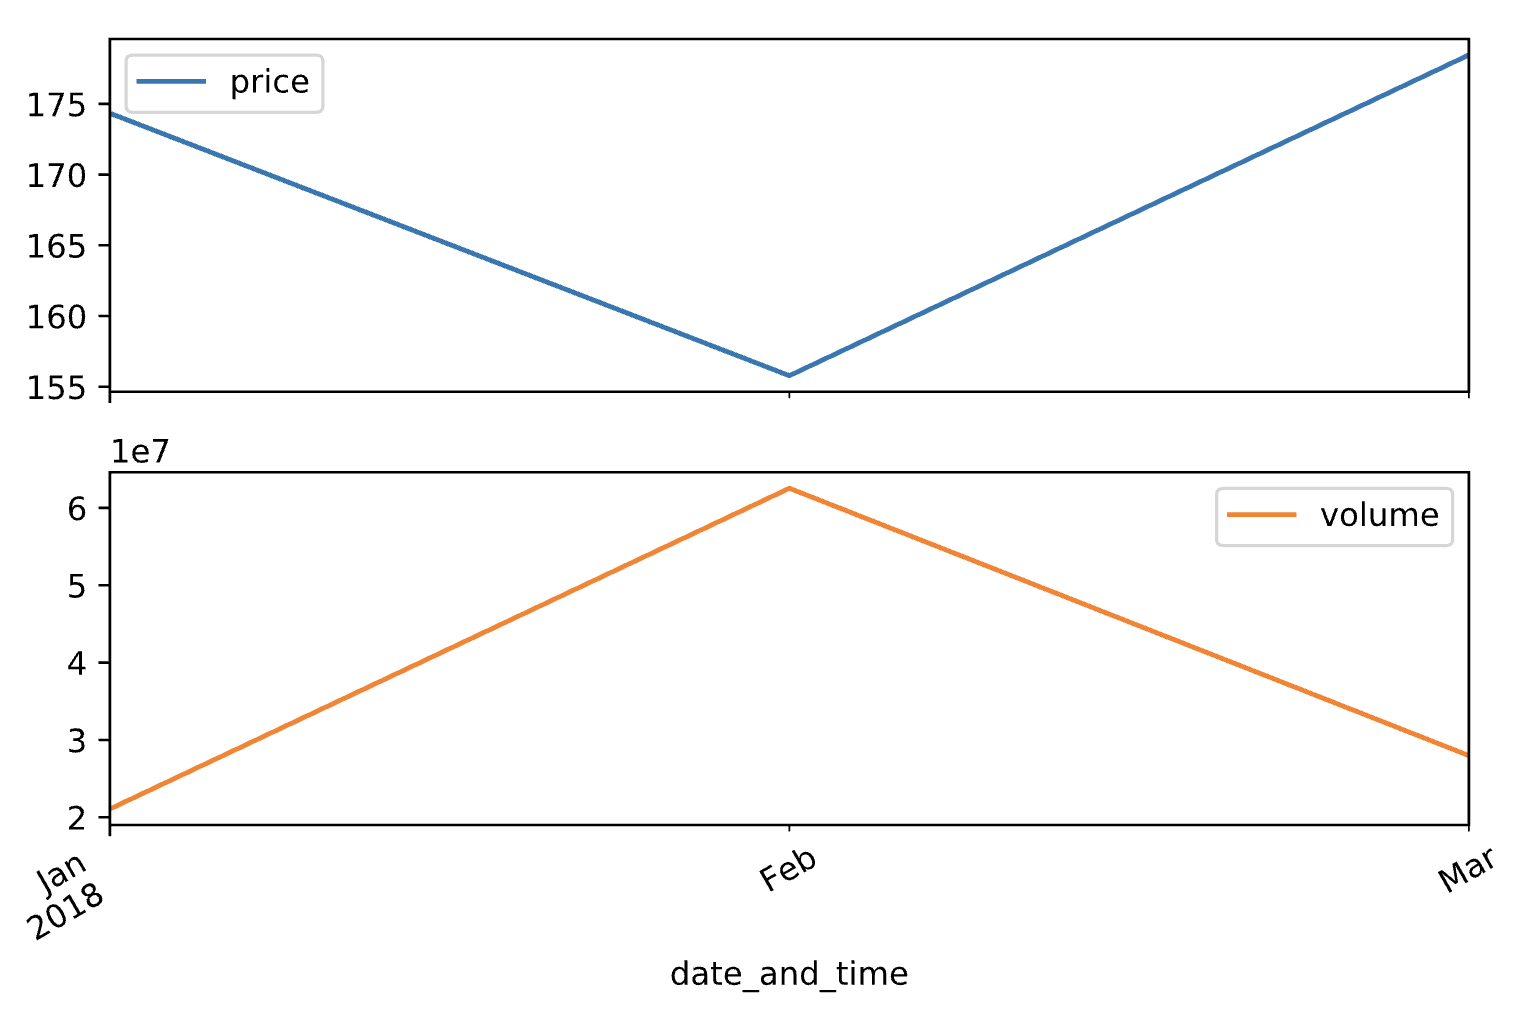
Gráficos de linhas separados do preço e volume médios mensais da ação da Apple

Analisando a Atividade Policial com pandas

Vamos praticar!

Analisando a Atividade Policial com pandas

Preparing Video For Download...