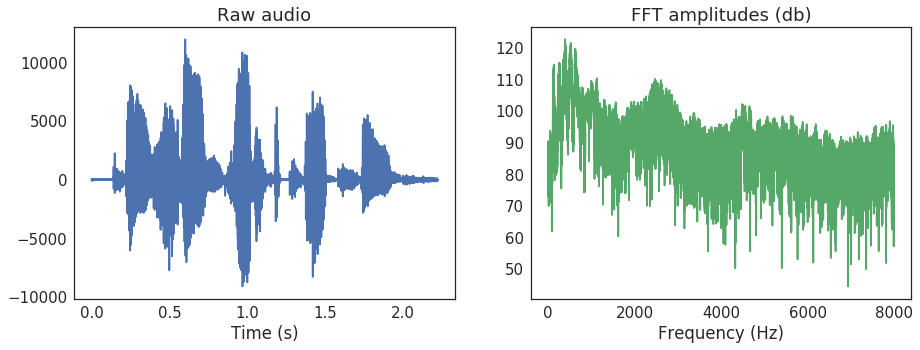
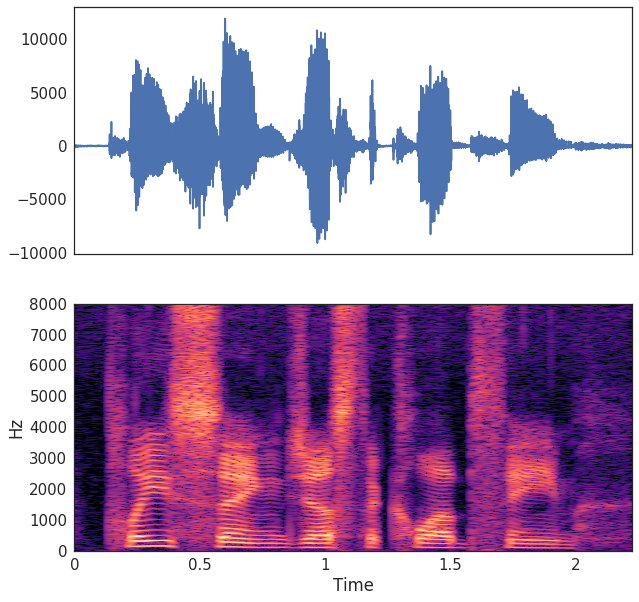
Spektrogram - perubahan spektral pada suara seiring waktu

Machine Learning untuk Data Deret Waktu di Python

Chris Holdgraf

Fellow, Berkeley Institute for Data Science

Fourier transform

  • Data runtun waktu dapat dijelaskan sebagai gabungan hal yang berubah cepat dan lambat
  • Tiap saat, kita dapat mendeskripsikan keberadaan relatif komponen yang cepat dan lambat
  • Cara termudah melakukannya disebut Fourier Transform
  • Ini mengubah satu runtun waktu menjadi array yang menggambarkannya sebagai gabungan osilasi
Machine Learning untuk Data Deret Waktu di Python

Fourier Transform (FFT)

Machine Learning untuk Data Deret Waktu di Python

Spektrogram: gabungan Fourier transform berjendela

  • Spektrogram adalah kumpulan Fourier transform berjendela sepanjang waktu
  • Mirip perhitungan rolling mean:
    1. Pilih ukuran dan bentuk jendela
    2. Pada suatu titik waktu, hitung FFT untuk jendela itu
    3. Geser jendela satu langkah
    4. Agregasikan hasilnya
  • Disebut Short-Time Fourier Transform (STFT)
Machine Learning untuk Data Deret Waktu di Python

Machine Learning untuk Data Deret Waktu di Python

Menghitung STFT

  • Kita dapat menghitung STFT dengan librosa
  • Ada beberapa parameter yang bisa disetel (mis. ukuran jendela)
  • Untuk tujuan kita, kita akan mengonversi ke decibel agar meratakan nilai rata-rata semua frekuensi
  • Lalu visualisasikan dengan fungsi specshow()
Machine Learning untuk Data Deret Waktu di Python

Menghitung STFT dengan kode

# Import the functions we'll use for the STFT
from librosa.core import stft, amplitude_to_db
from librosa.display import specshow
import matplotlib.pyplot as plt

# Calculate our STFT
HOP_LENGTH = 2**4
SIZE_WINDOW = 2**7
audio_spec = stft(audio, hop_length=HOP_LENGTH, n_fft=SIZE_WINDOW)

# Convert into decibels for visualization
spec_db = amplitude_to_db(audio_spec)

# Visualize
fig, ax = plt.subplots()
specshow(spec_db, sr=sfreq, x_axis='time', 
         y_axis='hz', hop_length=HOP_LENGTH, ax=ax)
Machine Learning untuk Data Deret Waktu di Python

Rekayasa fitur spektral

  • Setiap runtun waktu memiliki pola spektral yang berbeda.
  • Kita dapat menghitung pola spektral ini dengan menganalisis spektrogram.
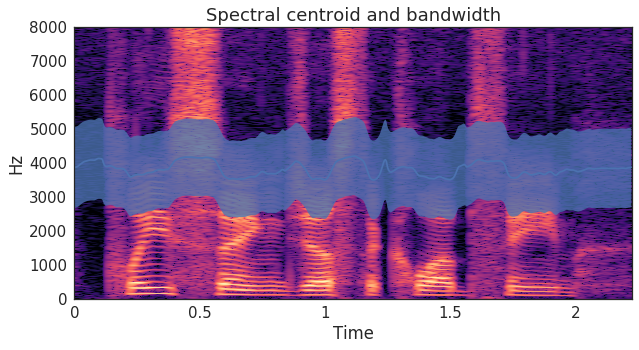
  • Contohnya, spectral bandwidth dan spectral centroid menggambarkan lokasi energi terbanyak di tiap saat
Machine Learning untuk Data Deret Waktu di Python

Menghitung fitur spektral

# Calculate the spectral centroid and bandwidth for the spectrogram
bandwidths = lr.feature.spectral_bandwidth(S=spec)[0]
centroids = lr.feature.spectral_centroid(S=spec)[0]

# Display these features on top of the spectrogram
fig, ax = plt.subplots()
specshow(spec, x_axis='time', y_axis='hz', hop_length=HOP_LENGTH, ax=ax)
ax.plot(times_spec, centroids)
ax.fill_between(times_spec, centroids - bandwidths / 2, 
                centroids + bandwidths / 2, alpha=0.5)
Machine Learning untuk Data Deret Waktu di Python

Menggabungkan fitur spektral dan temporal dalam pengklasifikasi

centroids_all = []
bandwidths_all = []
for spec in spectrograms:
    bandwidths = lr.feature.spectral_bandwidth(S=lr.db_to_amplitude(spec))
    centroids = lr.feature.spectral_centroid(S=lr.db_to_amplitude(spec))
    # Calculate the mean spectral bandwidth
    bandwidths_all.append(np.mean(bandwidths))  
    # Calculate the mean spectral centroid
    centroids_all.append(np.mean(centroids))  

# Create our X matrix
X = np.column_stack([means, stds, maxs, tempo_mean, 
                     tempo_max, tempo_std, bandwidths_all, centroids_all])
Machine Learning untuk Data Deret Waktu di Python

Ayo berlatih!

Machine Learning untuk Data Deret Waktu di Python

Preparing Video For Download...