Cross-validatie voor tijdreeksdata

Machine Learning voor tijdreeksgegevens in Python

Chris Holdgraf

Fellow, Berkeley Institute for Data Science

Cross-validatie met scikit-learn

# Iterating over the "split" method yields train/test indices
for tr, tt in cv.split(X, y):
    model.fit(X[tr], y[tr])
    model.score(X[tt], y[tt])
Machine Learning voor tijdreeksgegevens in Python

Typen cross-validatie: KFold

  • KFold-cross-validatie splitst je data in meerdere even grote "folds"
  • Dit is een van de meest gebruikte cross-validatiemethoden

      from sklearn.model_selection import KFold
      cv = KFold(n_splits=5)
      for tr, tt in cv.split(X, y):
          ...
    
Machine Learning voor tijdreeksgegevens in Python

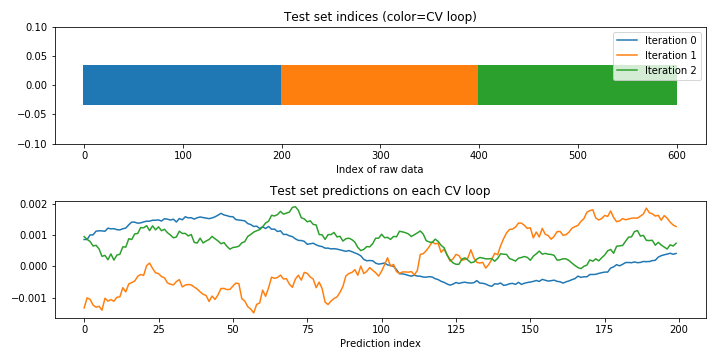
Modelvoorspellingen visualiseren

fig, axs = plt.subplots(2, 1)

# Plot the indices chosen for validation on each loop
axs[0].scatter(tt, [0] * len(tt), marker='_', s=2, lw=40)
axs[0].set(ylim=[-.1, .1], title='Testset-indices (kleur=CV-loop)', 
           xlabel='Index van ruwe data')

# Plot the model predictions on each iteration
axs[1].plot(model.predict(X[tt]))
axs[1].set(title='Testset-voorspellingen per CV-loop', 
           xlabel='Voorspellingsindex')
Machine Learning voor tijdreeksgegevens in Python

KFold-CV-gedrag visualiseren

Machine Learning voor tijdreeksgegevens in Python

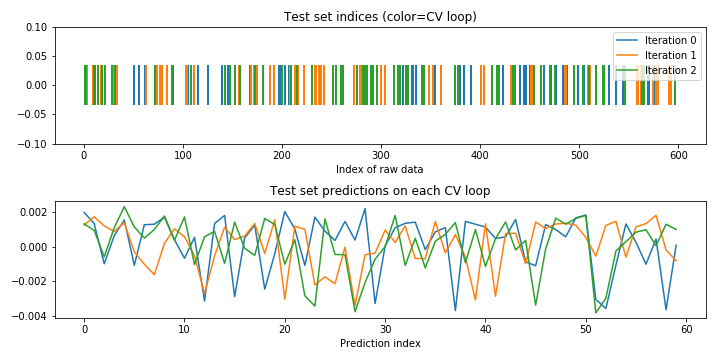
Let op bij shufflen van je data

  • Veel CV-iteratoren laten je data shufflen tijdens cross-validatie.
  • Dit werkt alleen als de data i.i.d. is; tijdreeksen zijn dat meestal niet.
  • Shuffle je data dus niet bij voorspellen met tijdreeksen.

      from sklearn.model_selection import ShuffleSplit
    
      cv = ShuffleSplit(n_splits=3)
      for tr, tt in cv.split(X, y):
          ...
    
Machine Learning voor tijdreeksgegevens in Python

Geshuffeld CV-gedrag visualiseren

Machine Learning voor tijdreeksgegevens in Python

De time series CV-iterator gebruiken

  • Tot nu toe hebben we de lineaire tijdsvolgorde doorbroken in de cross-validatie
  • Maar je moet doorgaans geen punten uit de toekomst gebruiken om het verleden te voorspellen
  • Aanpak: gebruik trainingsdata uit het verleden om de toekomst te voorspellen
Machine Learning voor tijdreeksgegevens in Python

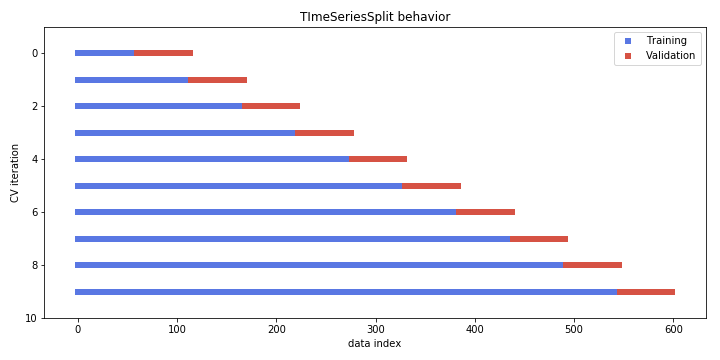
Cross-validatie-iteratoren voor tijdreeksen visualiseren

# Import and initialize the cross-validation iterator
from sklearn.model_selection import TimeSeriesSplit
cv = TimeSeriesSplit(n_splits=10)

fig, ax = plt.subplots(figsize=(10, 5))
for ii, (tr, tt) in enumerate(cv.split(X, y)):
    # Plot training and test indices
    l1 = ax.scatter(tr, [ii] * len(tr), c=[plt.cm.coolwarm(.1)], 
                    marker='_', lw=6)
    l2 = ax.scatter(tt, [ii] * len(tt), c=[plt.cm.coolwarm(.9)], 
                    marker='_', lw=6)
    ax.set(ylim=[10, -1], title='TimeSeriesSplit-gedrag', 
           xlabel='data-index', ylabel='CV-iteratie')
    ax.legend([l1, l2], ['Training', 'Validatie'])
Machine Learning voor tijdreeksgegevens in Python

De TimeSeriesSplit-cross-validatie-iterator visualiseren
Machine Learning voor tijdreeksgegevens in Python

Aangepaste scoringsfuncties in scikit-learn

def myfunction(estimator, X, y):
    y_pred = estimator.predict(X)
    my_custom_score = my_custom_function(y_pred, y)
    return my_custom_score
Machine Learning voor tijdreeksgegevens in Python

Een aangepaste correlatiefunctie voor scikit-learn

def my_pearsonr(est, X, y):
    # Generate predictions and convert to a vector 
    y_pred = est.predict(X).squeeze()

    # Use the numpy "corrcoef" function to calculate a correlation matrix
    my_corrcoef_matrix = np.corrcoef(y_pred, y.squeeze())

    # Return a single correlation value from the matrix
    my_corrcoef = my_corrcoef[1, 0]
    return my_corrcoef
Machine Learning voor tijdreeksgegevens in Python

Laten we oefenen!

Machine Learning voor tijdreeksgegevens in Python

Preparing Video For Download...