Een staafdiagram maken
Introductie tot Data Science in Python

Hillary Green-Lerman
Lead Data Scientist, Looker
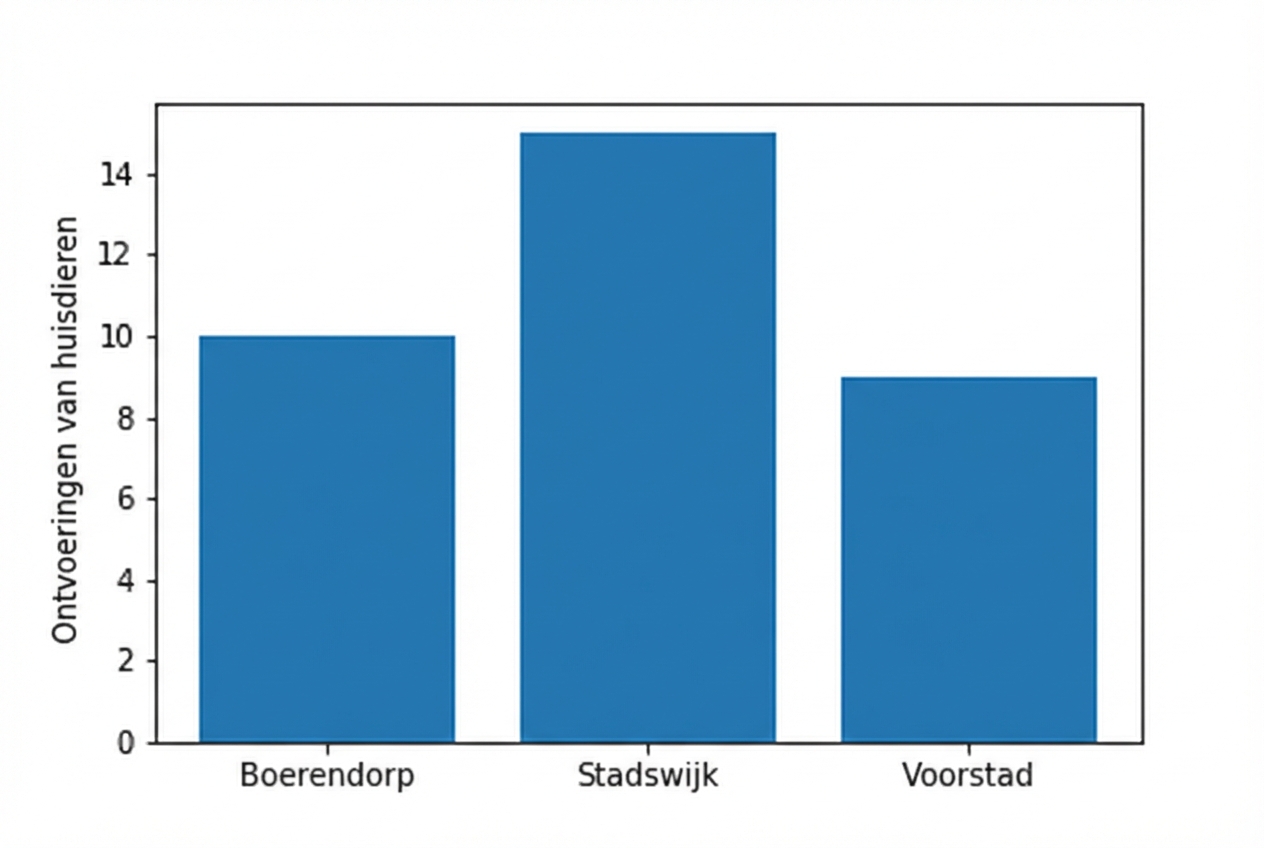
Dierendiefstallen vergelijken
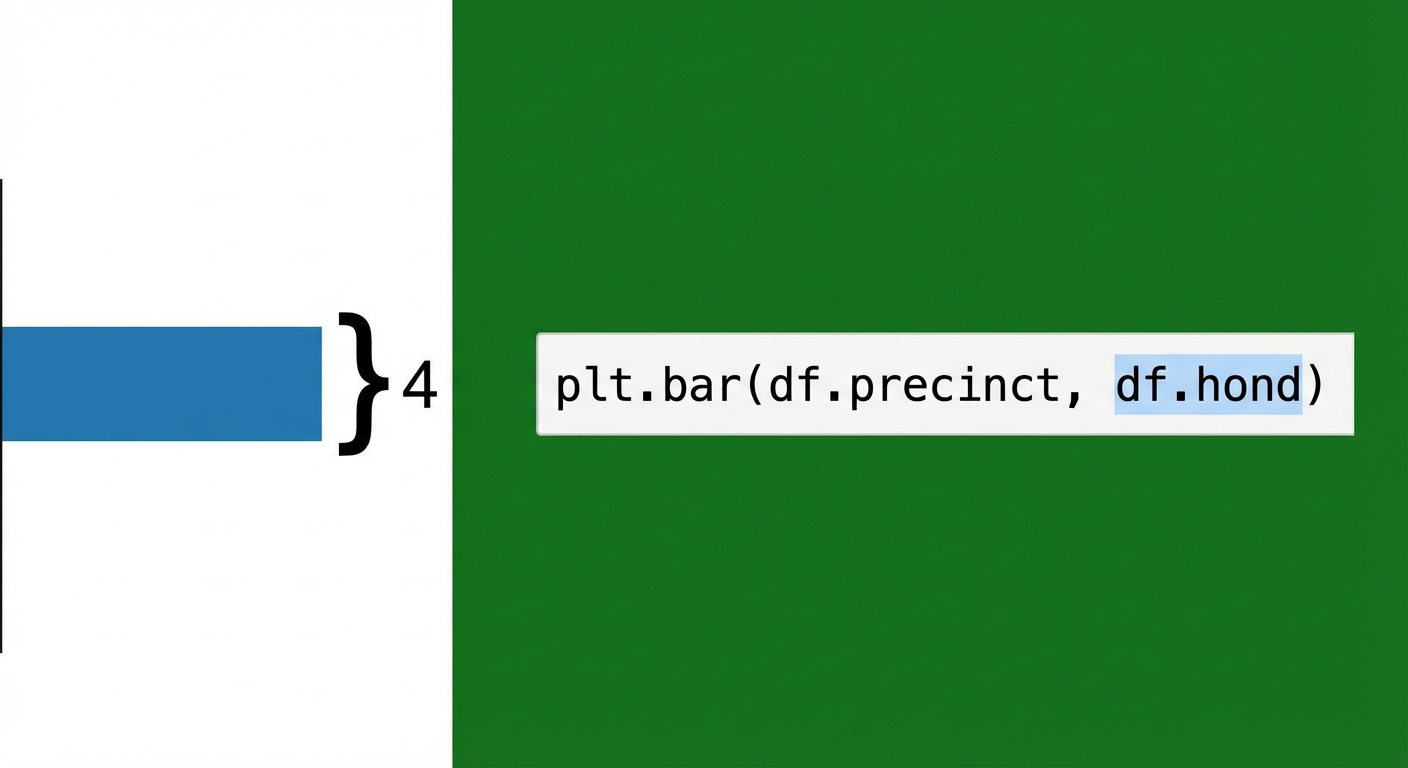
plt.bar(df.precinct,
        df.pets_abducted)

plt.ylabel('Pet Abductions')
plt.show()
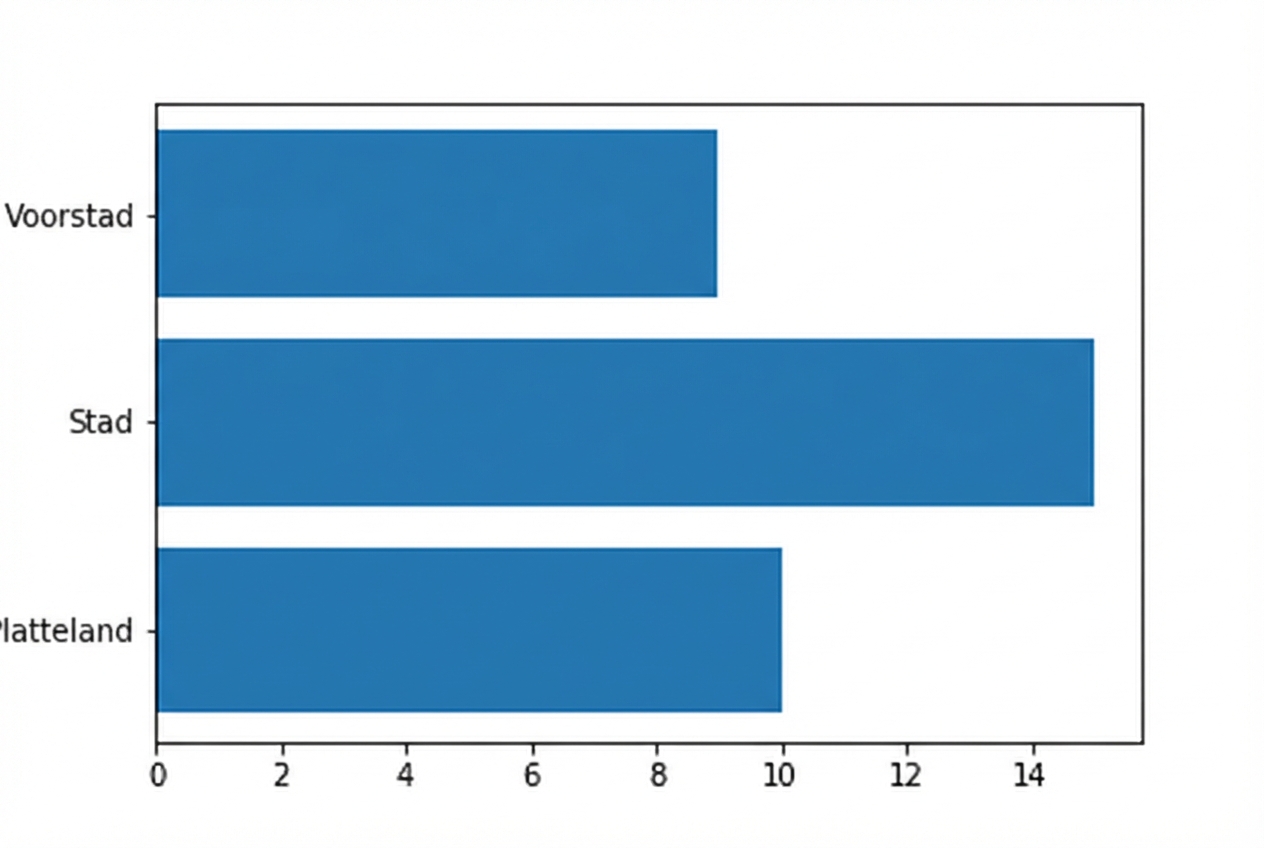
Horizontale staafdiagrammen
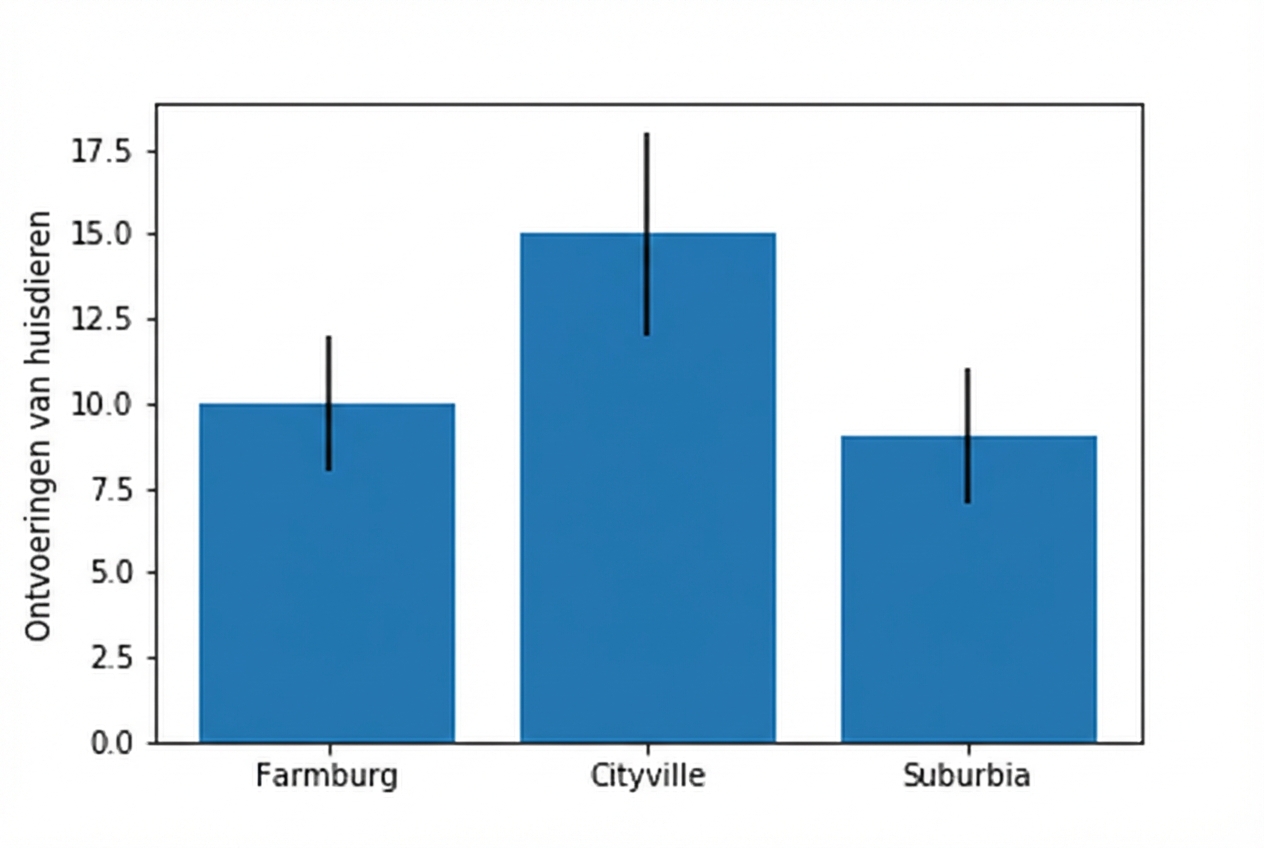
Foutbalken toevoegen
plt.bar(df.precinct, df.pet_abductions,
        yerr=df.error)

plt.ylabel('Pet Abductions')
plt.show()
Gestapelde staafdiagrammen
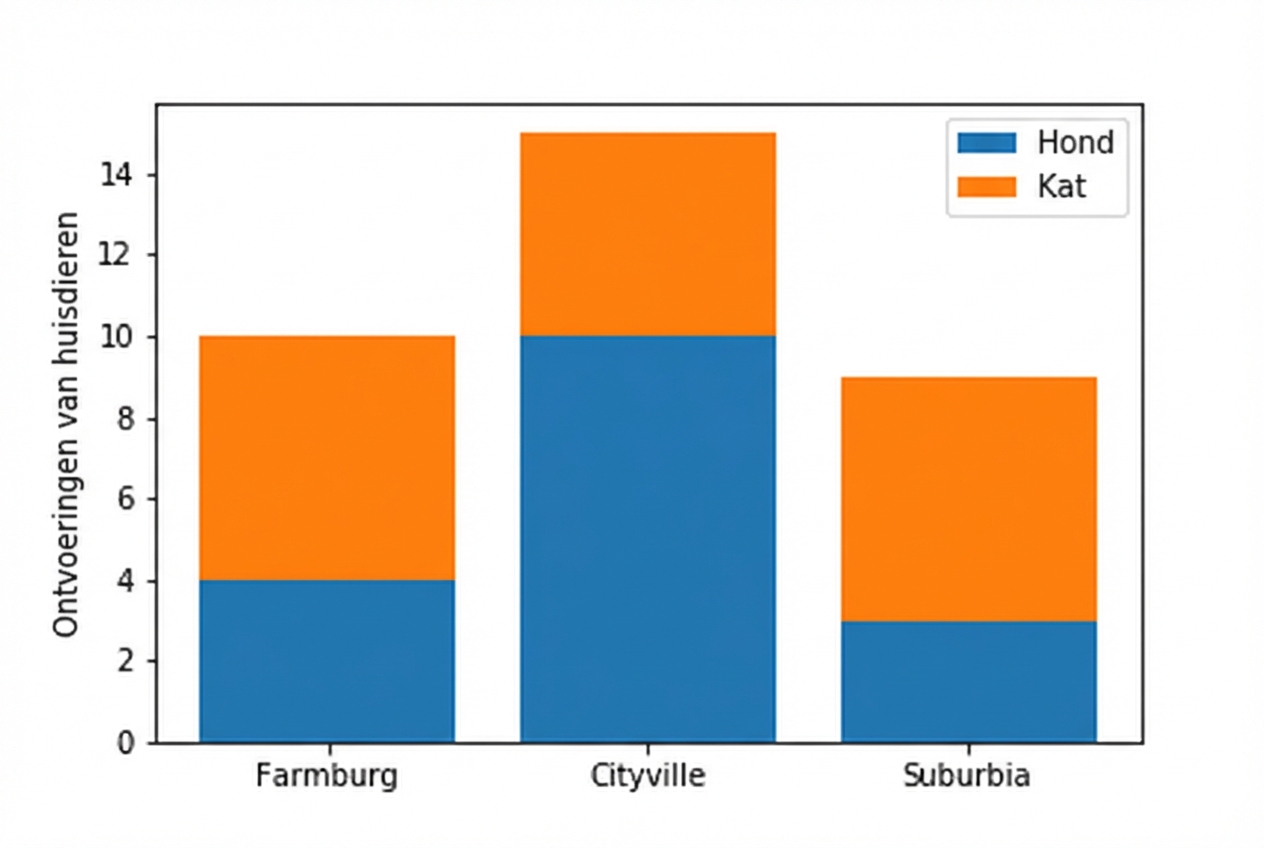
Gestapelde staafdiagrammen
Gestapelde staafdiagrammen
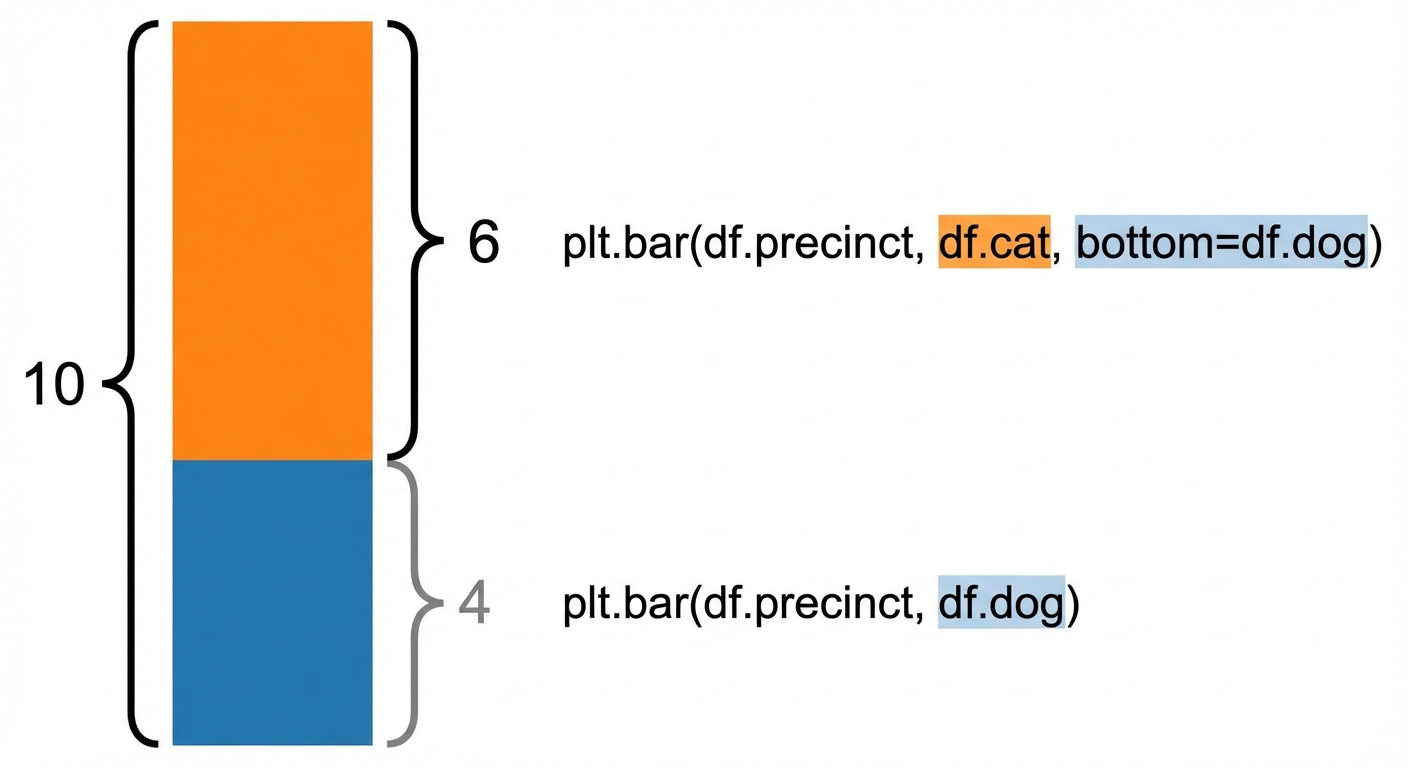
Gestapelde staafdiagrammen

