Wat is een functie?
Introductie tot Data Science in Python

Hillary Green-Lerman
Lead Data Scientist, Looker
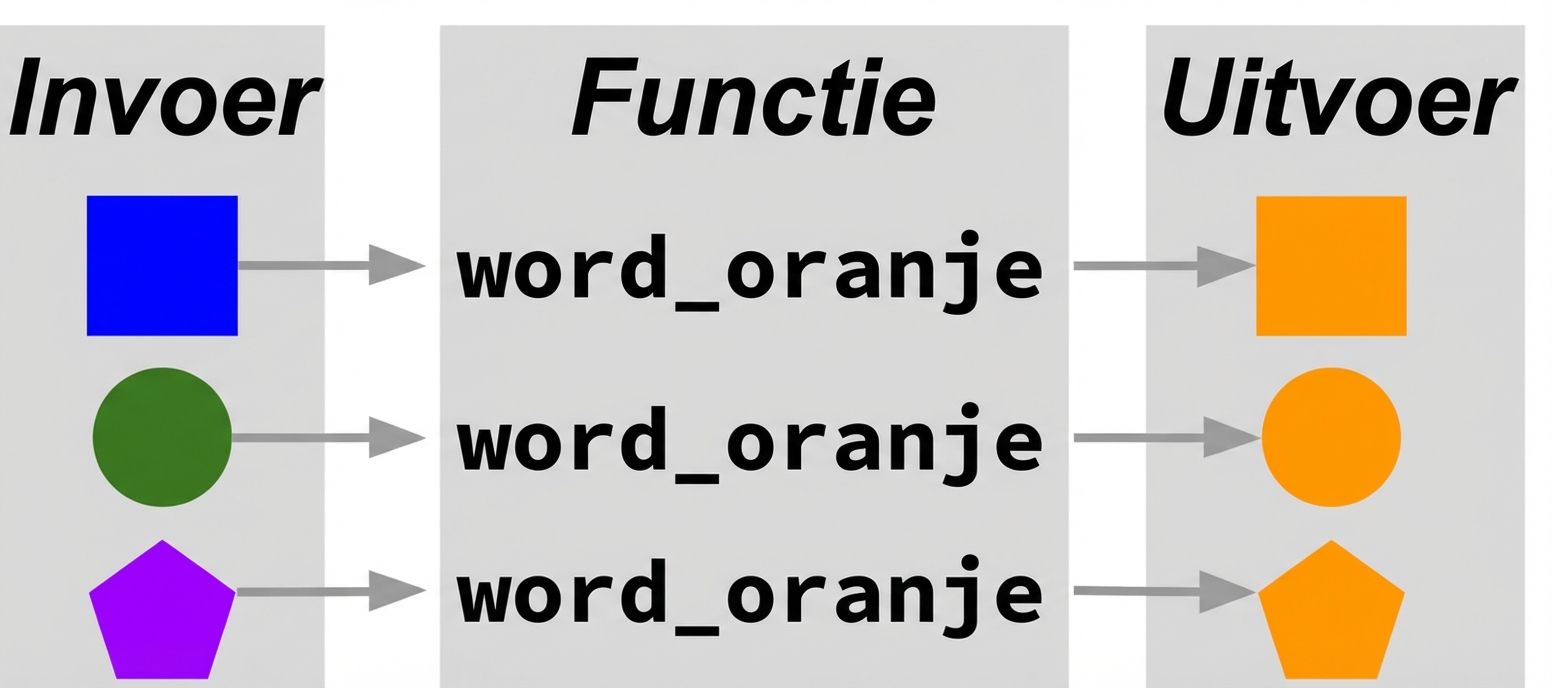
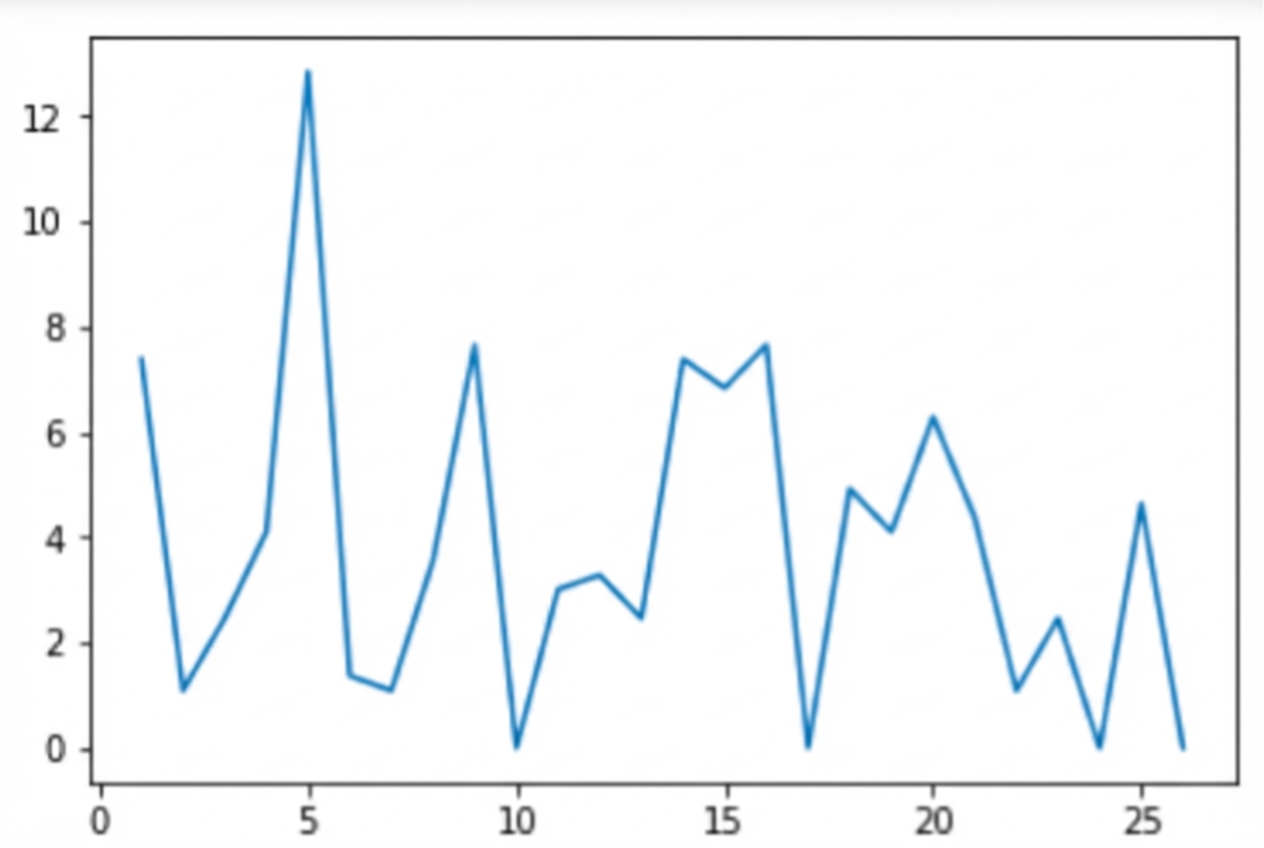
Een functie is een actie
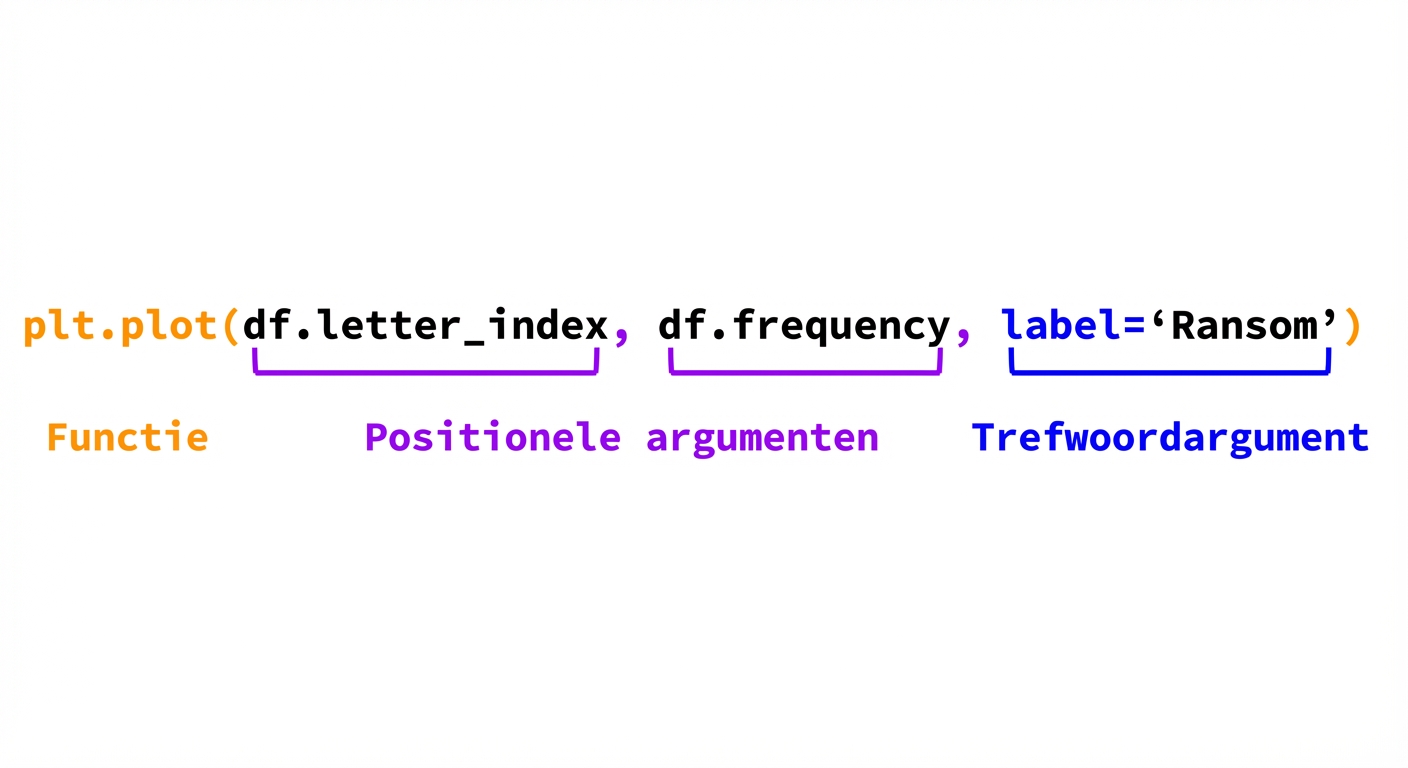
Anatomie van een functie: functienaam
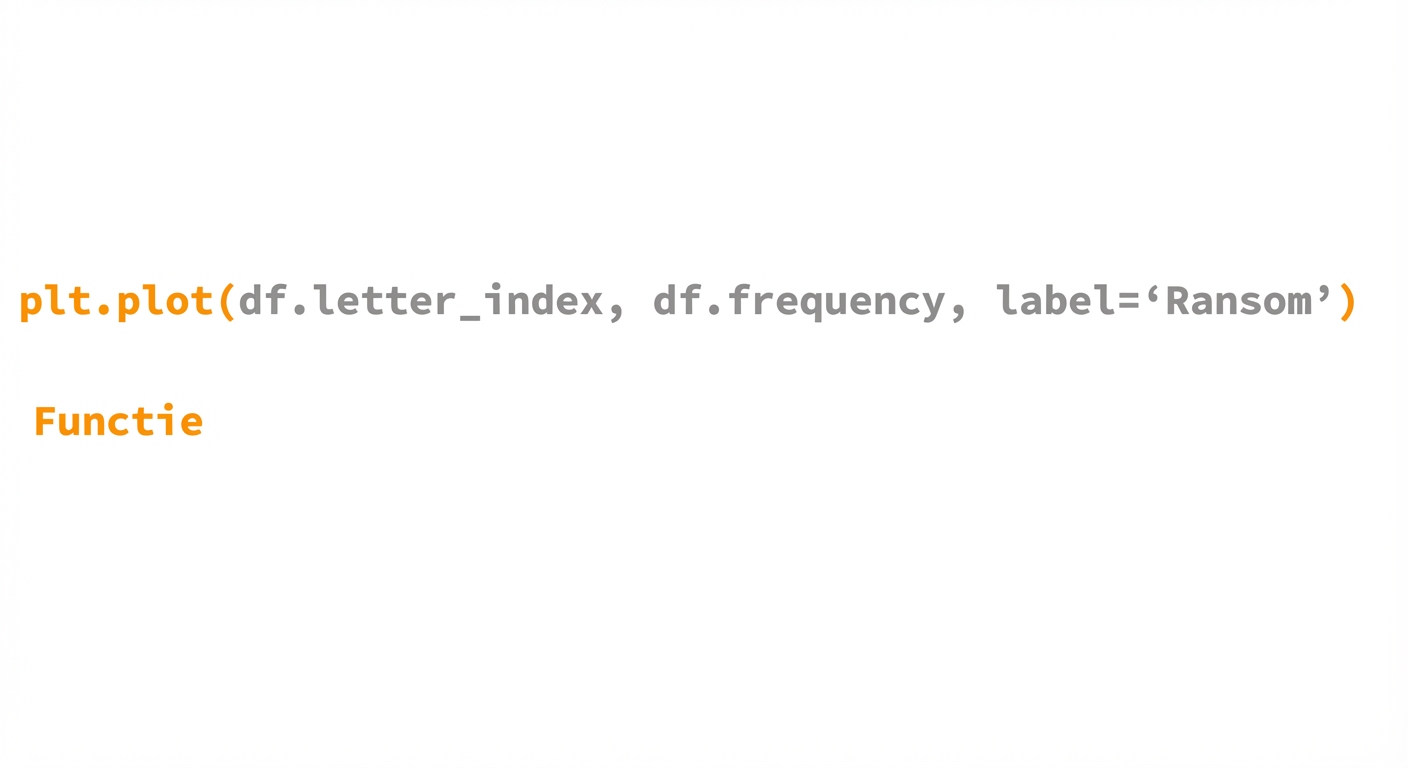
Functienaam:
- Begint met de module waarin de functie "leeft" (
plt) - Gevolgd door de naam van de functie (
plot) - Functienaam wordt altijd gevolgd door haakjes
()
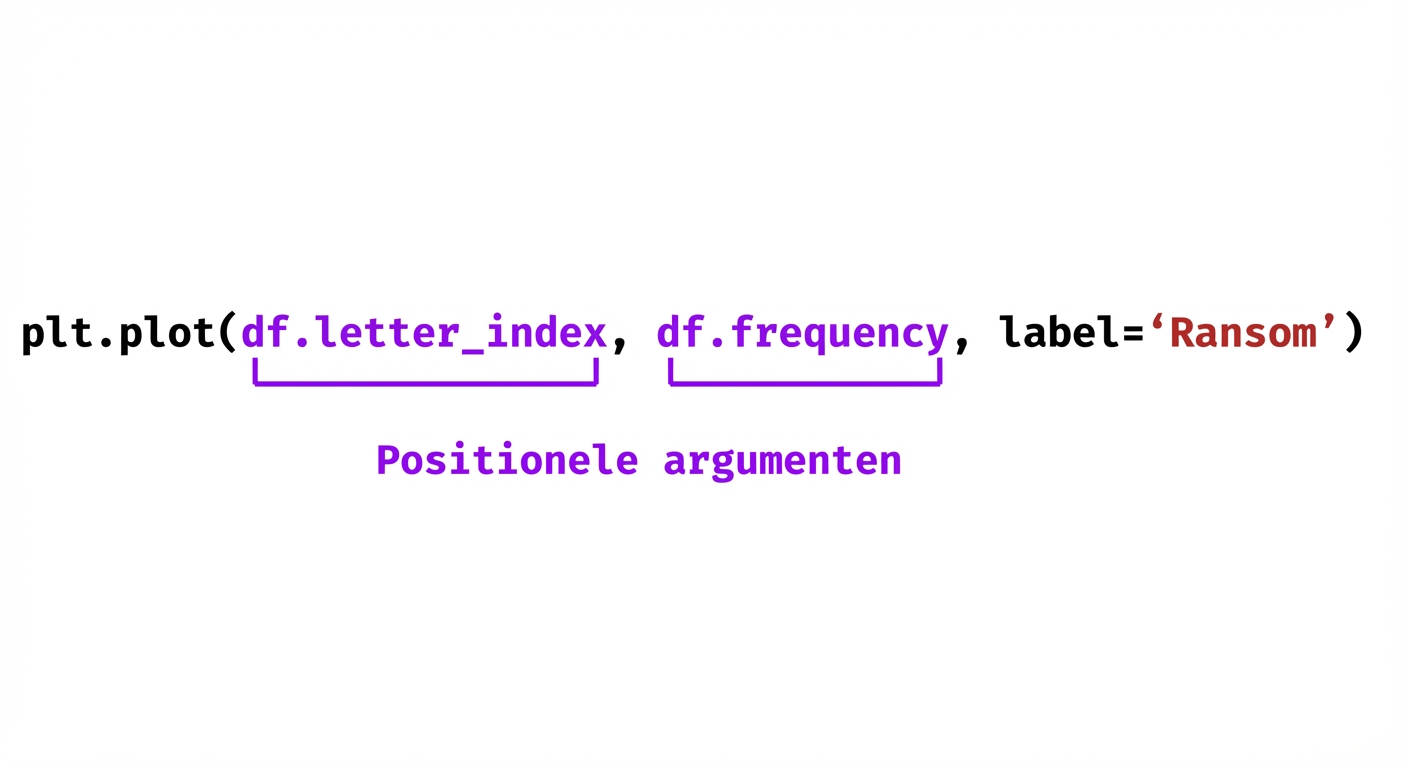
Anatomie van een functie: positional arguments
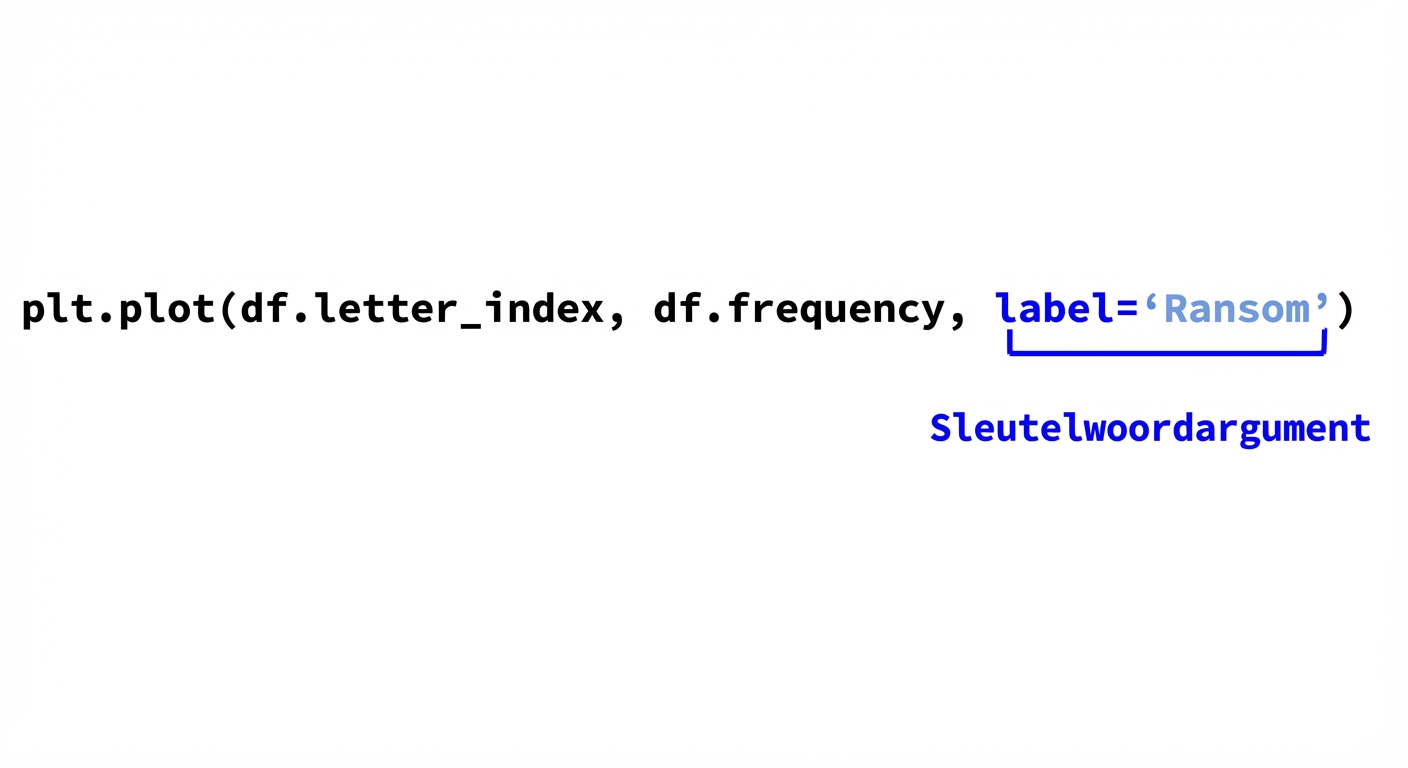
Anatomie van een functie: keyword arguments
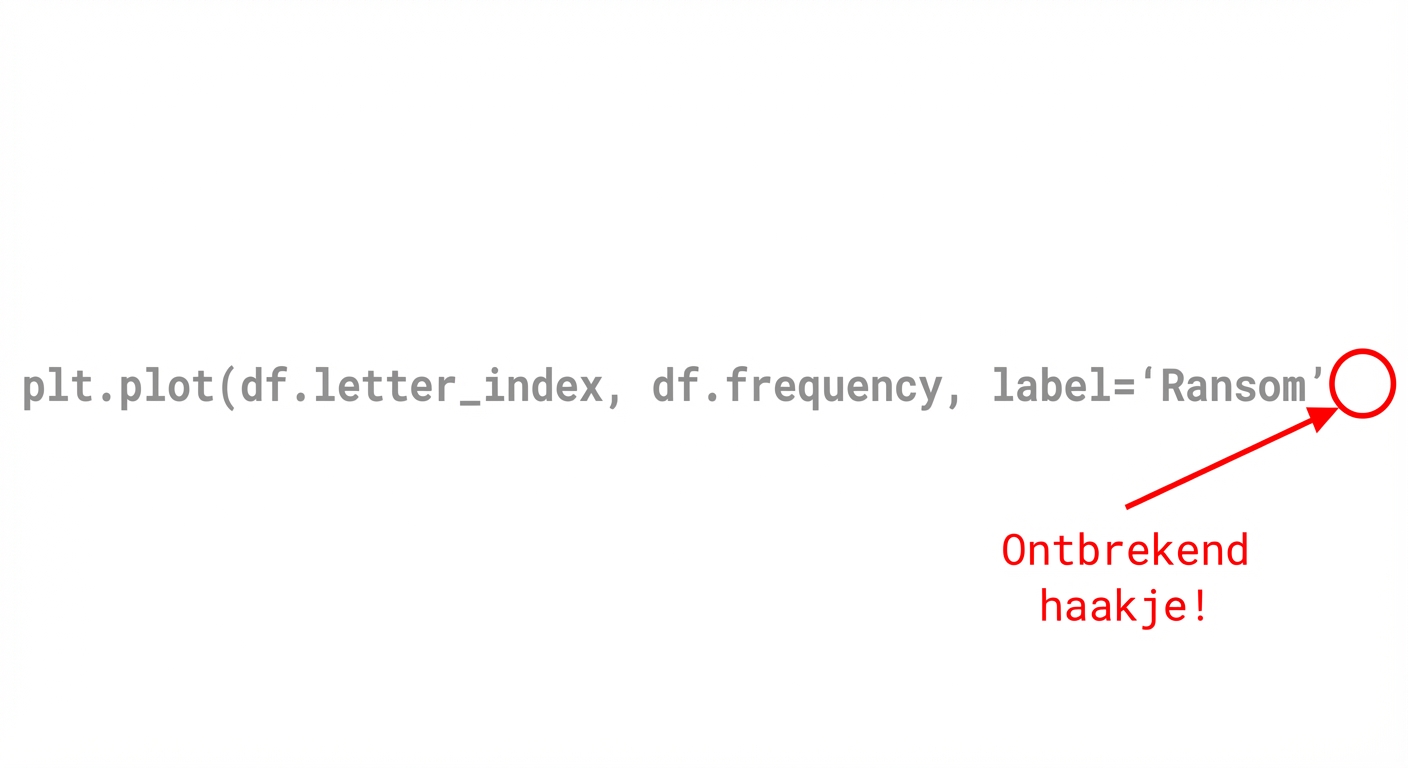
Veelvoorkomende functiefouten
- Ontbrekende komma's tussen argumenten
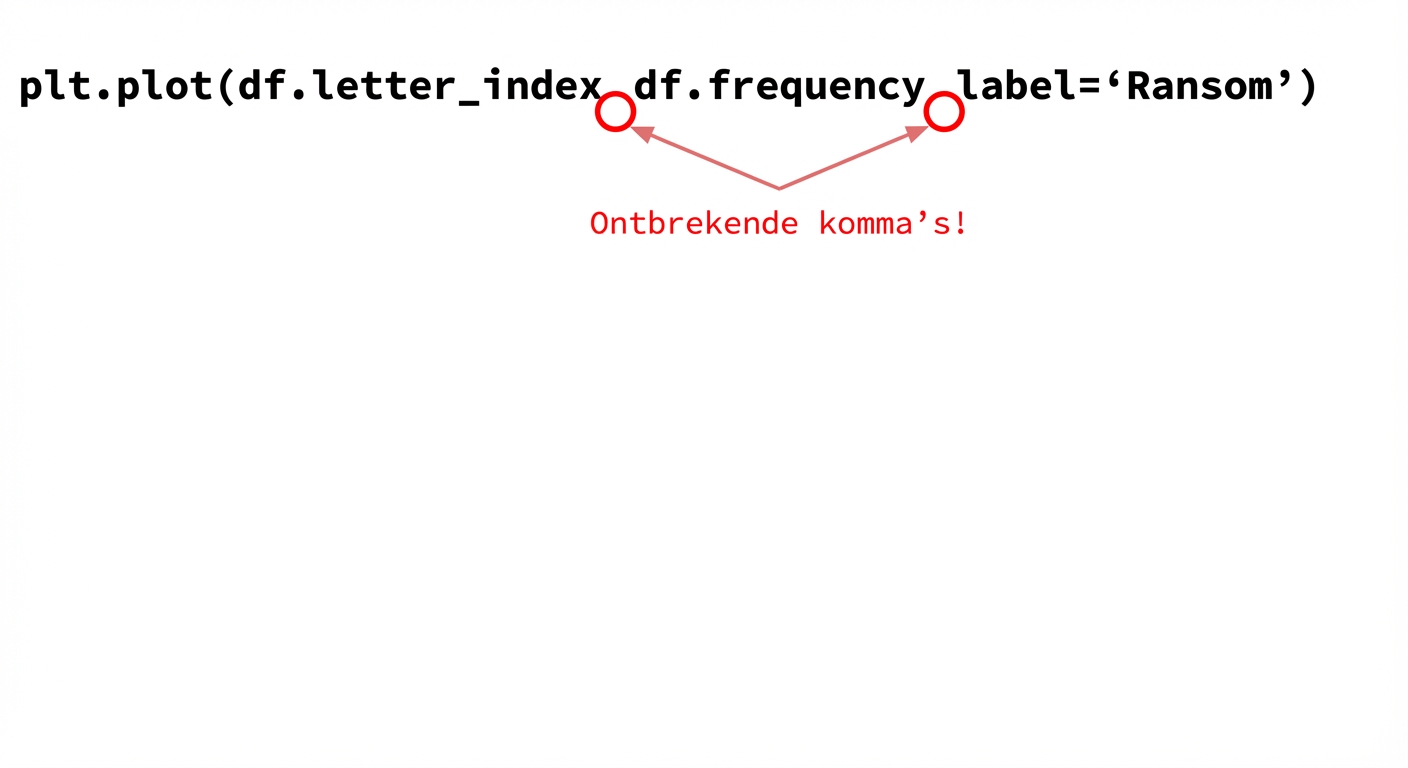
- Ontbrekende sluitende haakjes