Lijndiagrammen maken
Introductie tot Data Science in Python

Hillary Green-Lerman
Lead Data Scientist, Looker
Het plot verdikt
Van DataFrame naar Visualisatie
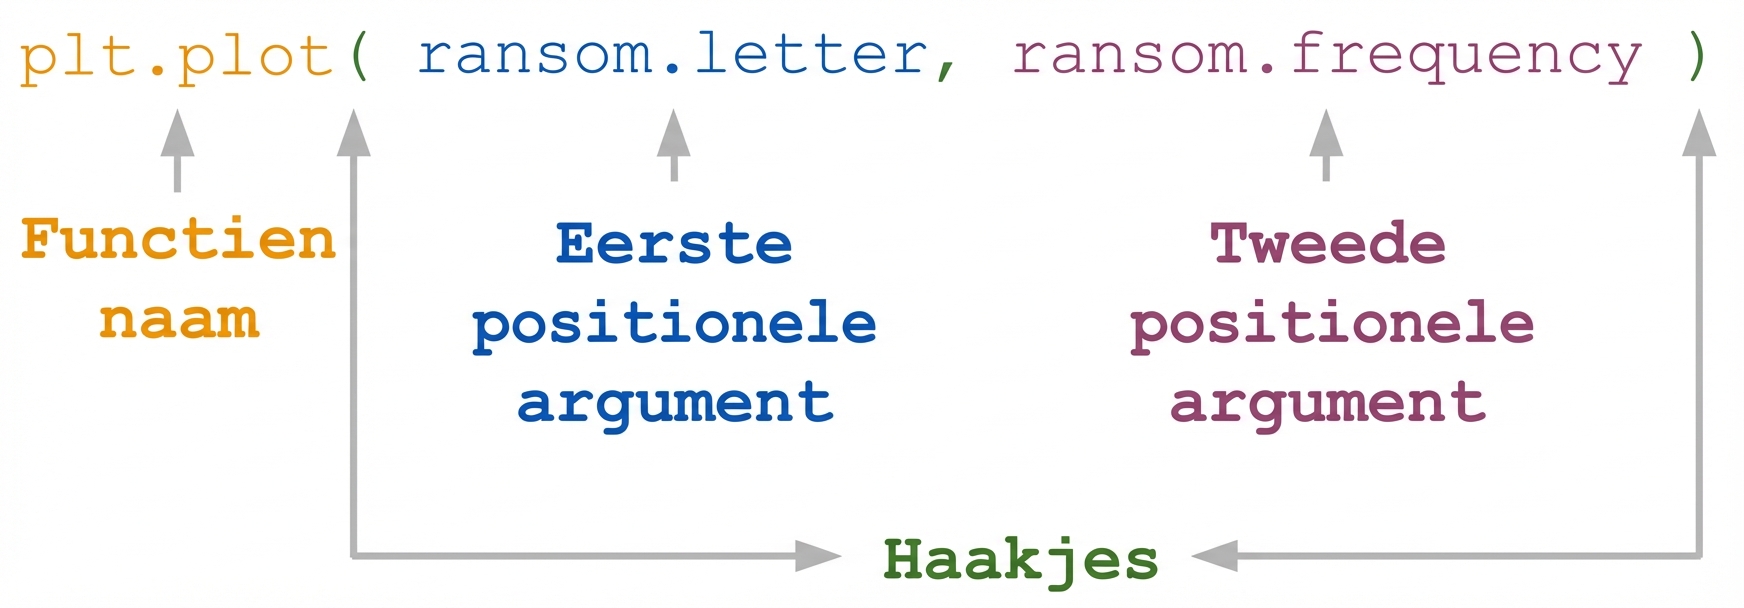
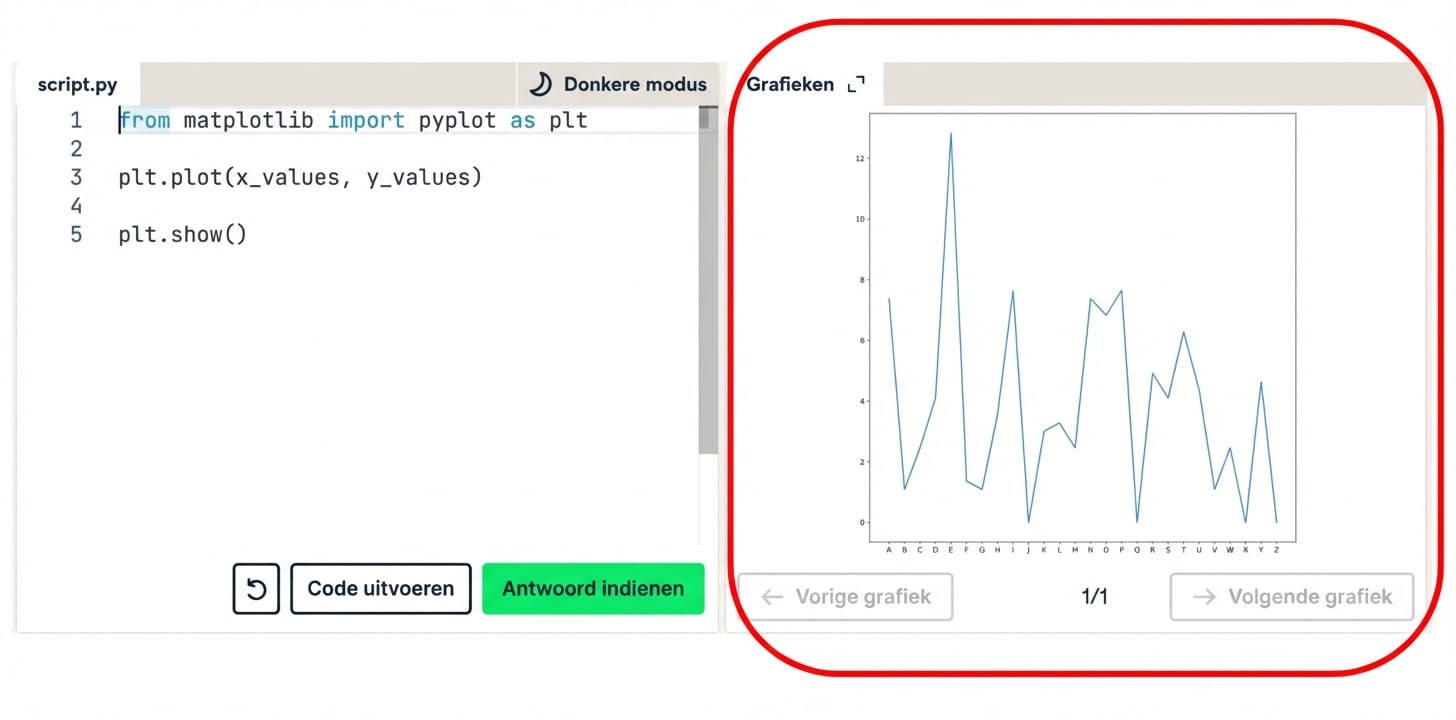
Introductie tot Matplotlib
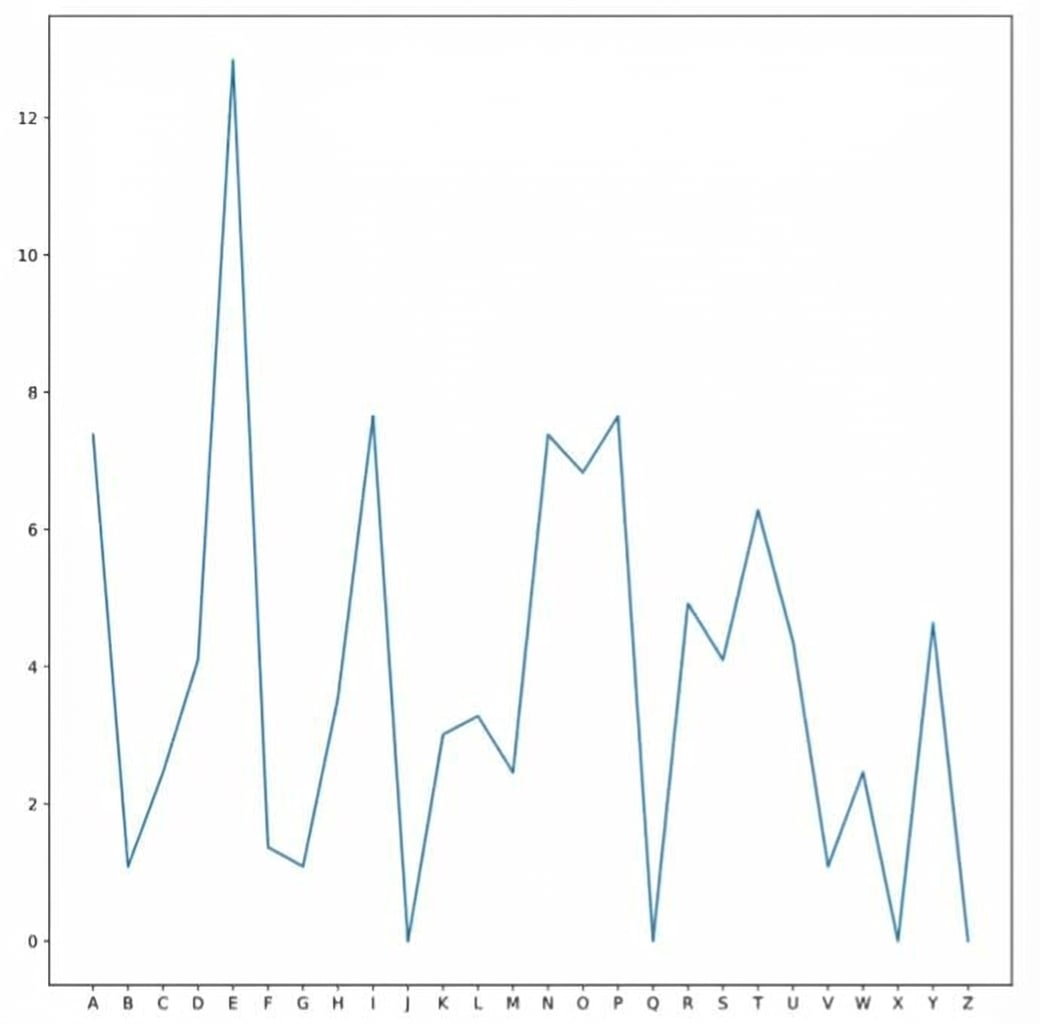
Lijndiagram
Resultaten weergeven
plt.show()
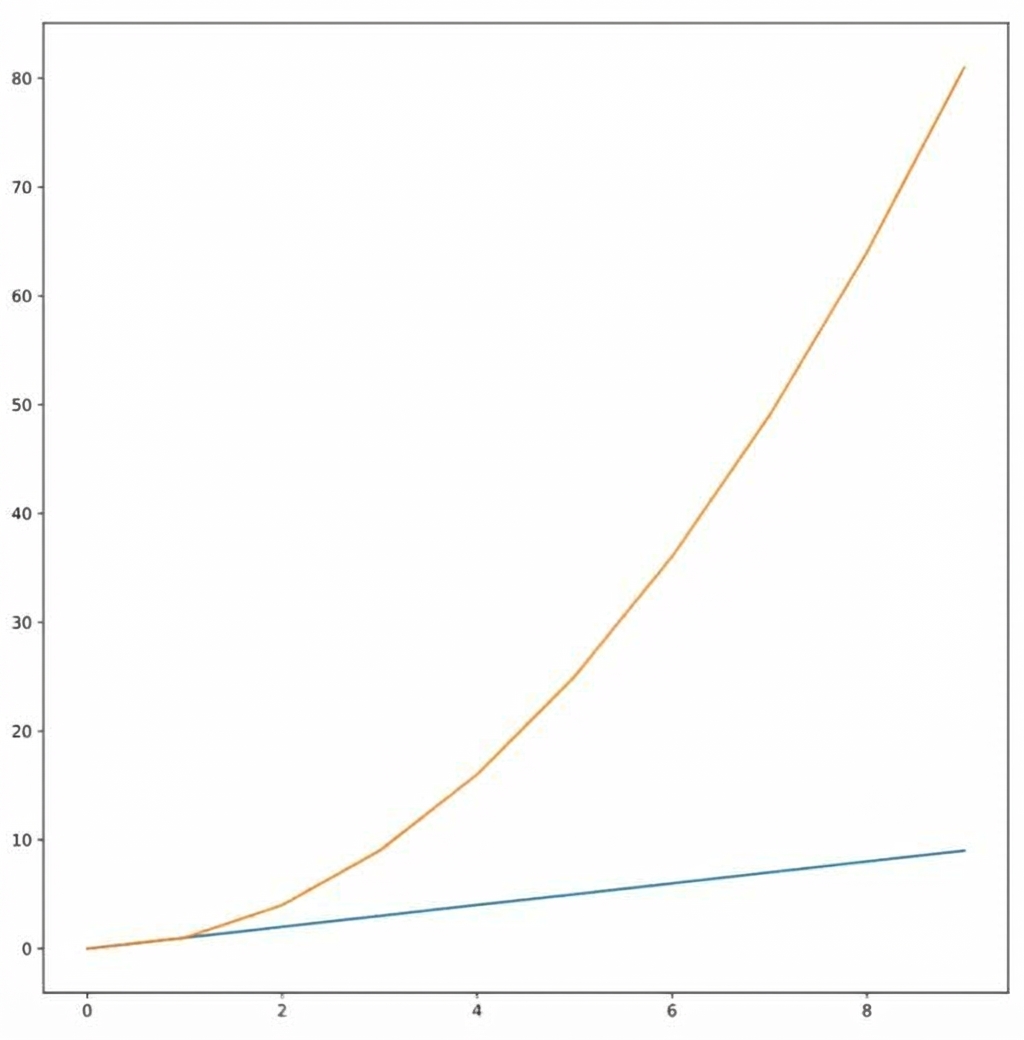
Meerdere lijnen