Labels en legenda's toevoegen
Introductie tot Data Science in Python

Hillary Green-Lerman
Lead Data Scientist, Looker
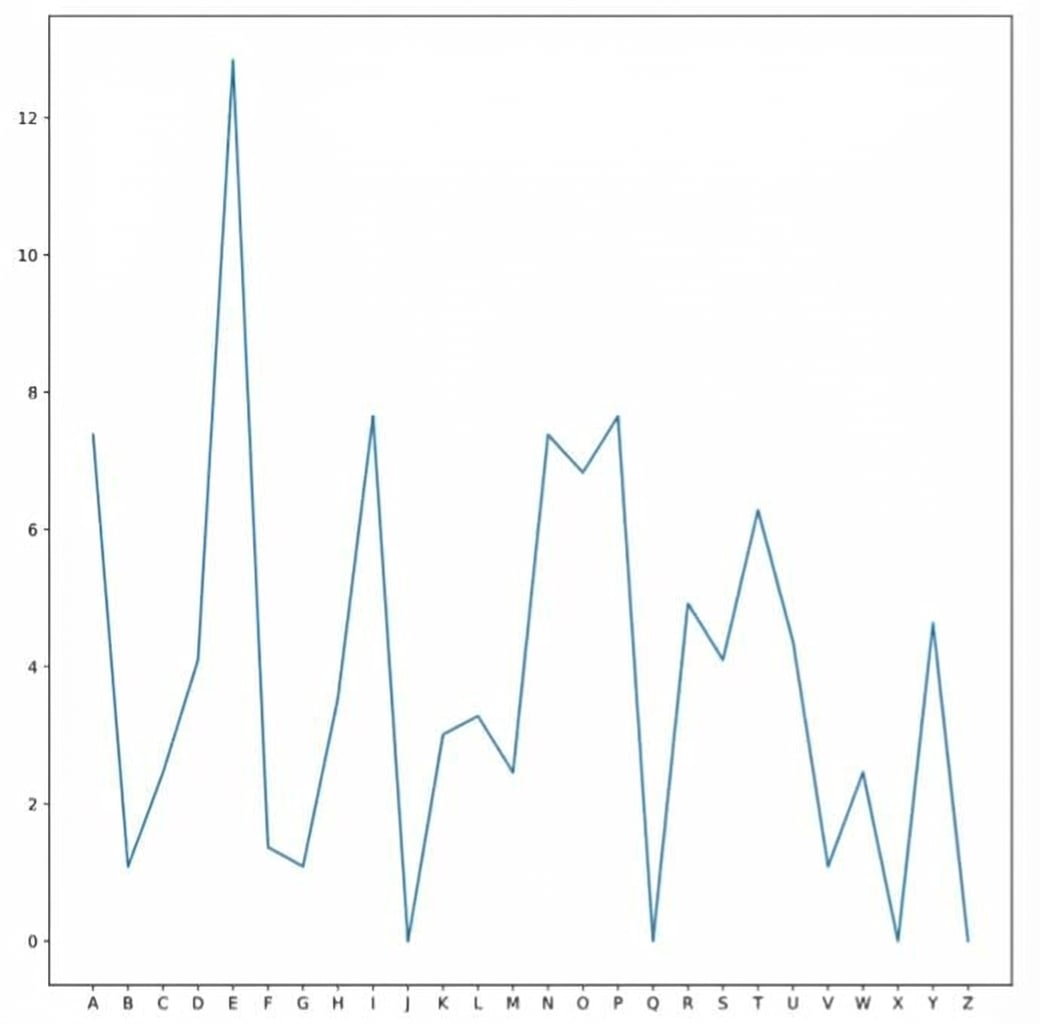
Wat hebben we net geplot?
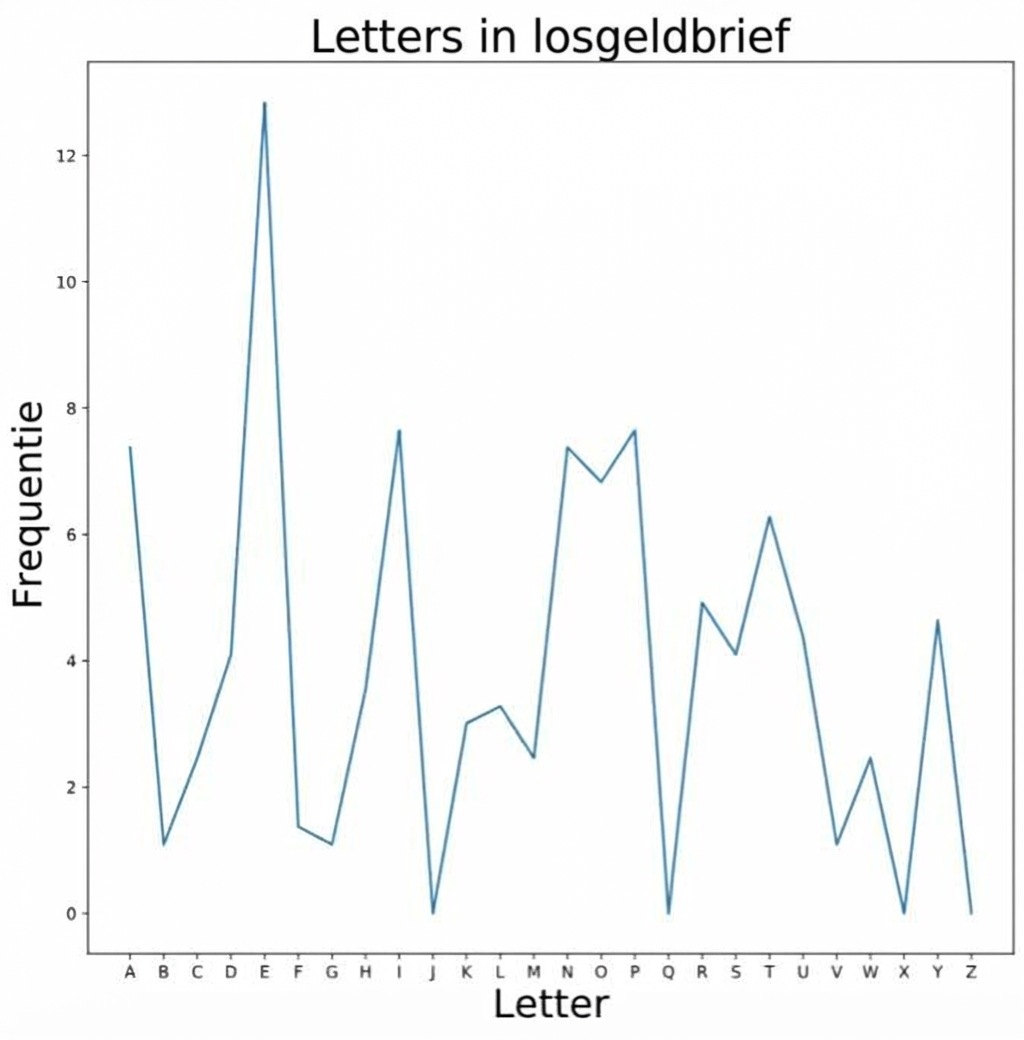
Assen en titellabels
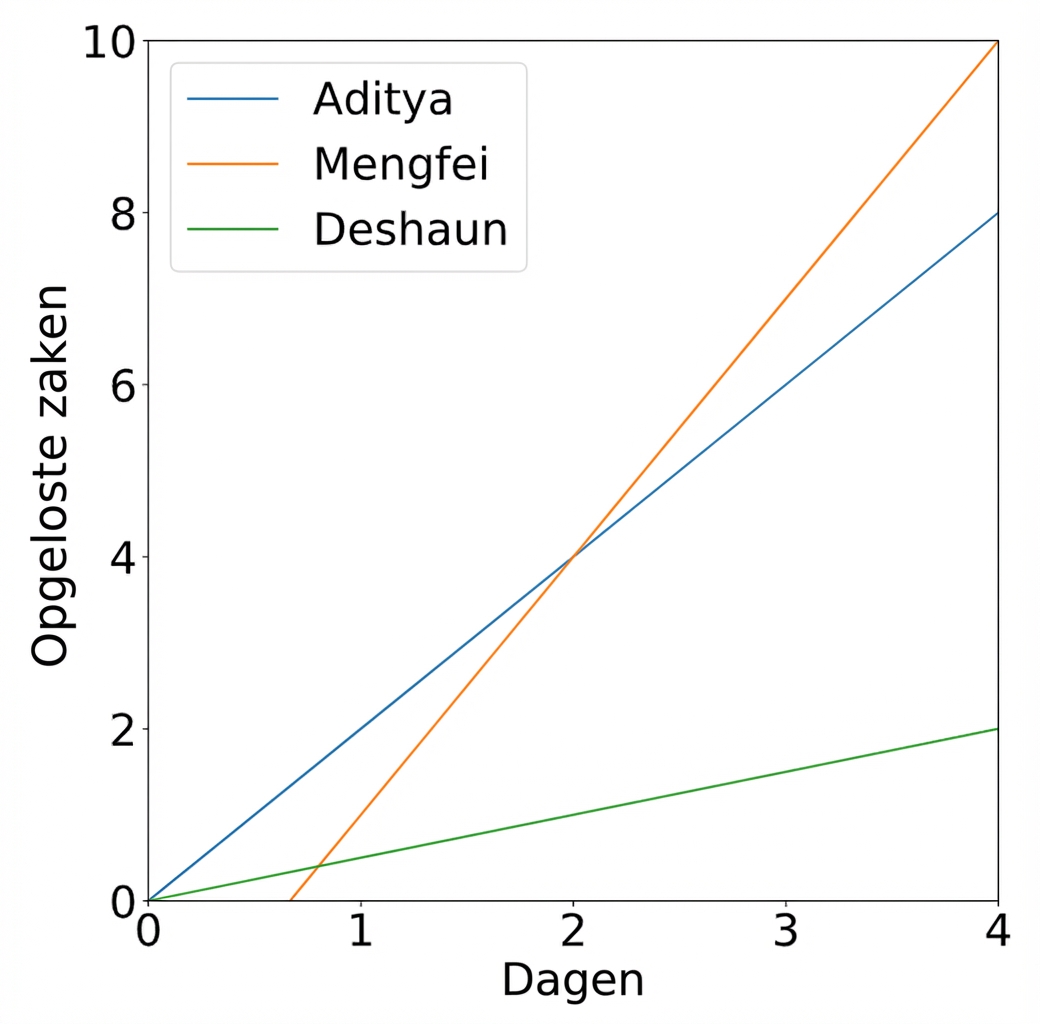
Legenda's
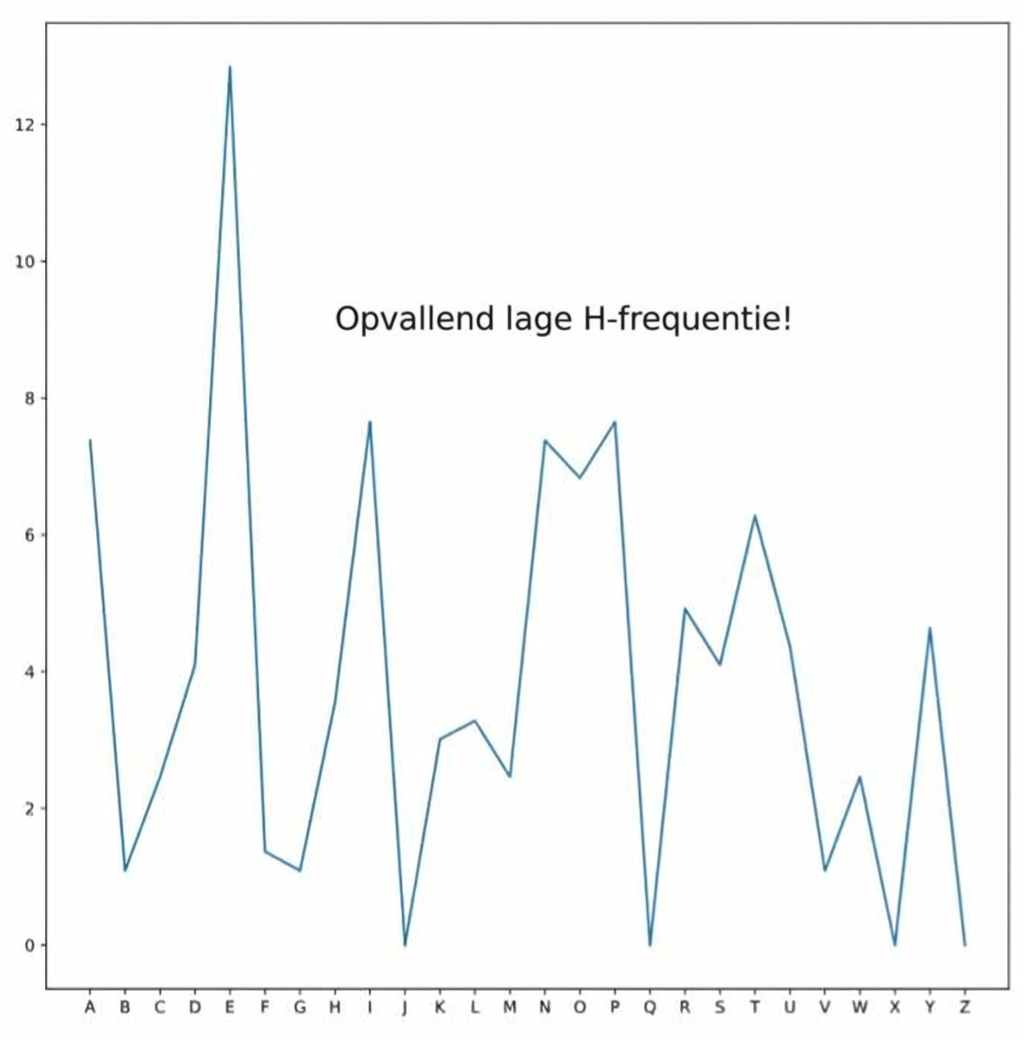
Willekeurige tekst
Introductie tot Data Science in Python
Hillary Green-Lerman
Lead Data Scientist, Looker

