Een histogram maken
Introductie tot Data Science in Python

Hillary Green-Lerman
Lead Data Scientist, Looker
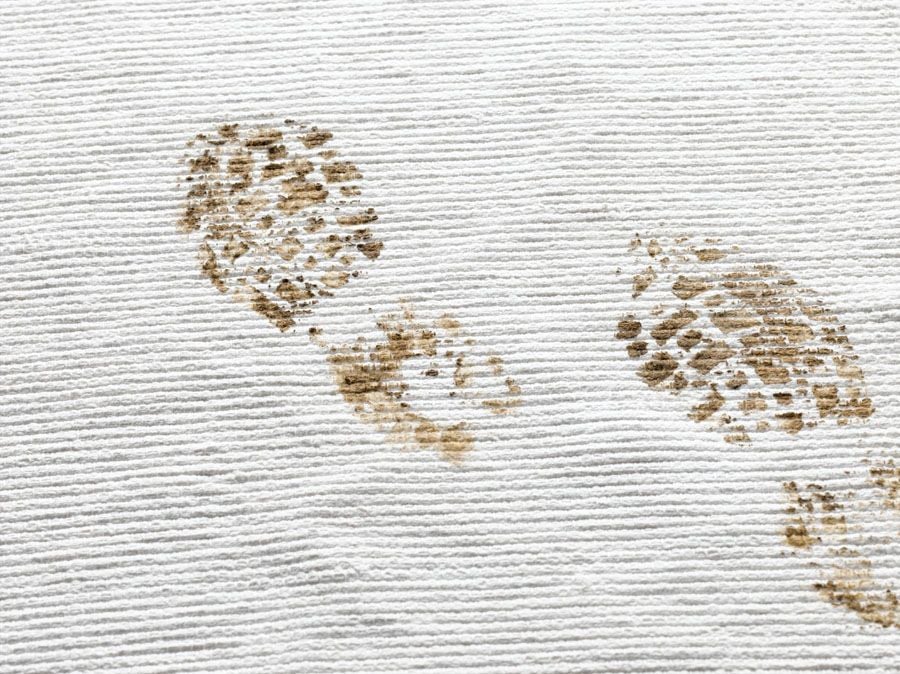
De ontvoerder opsporen
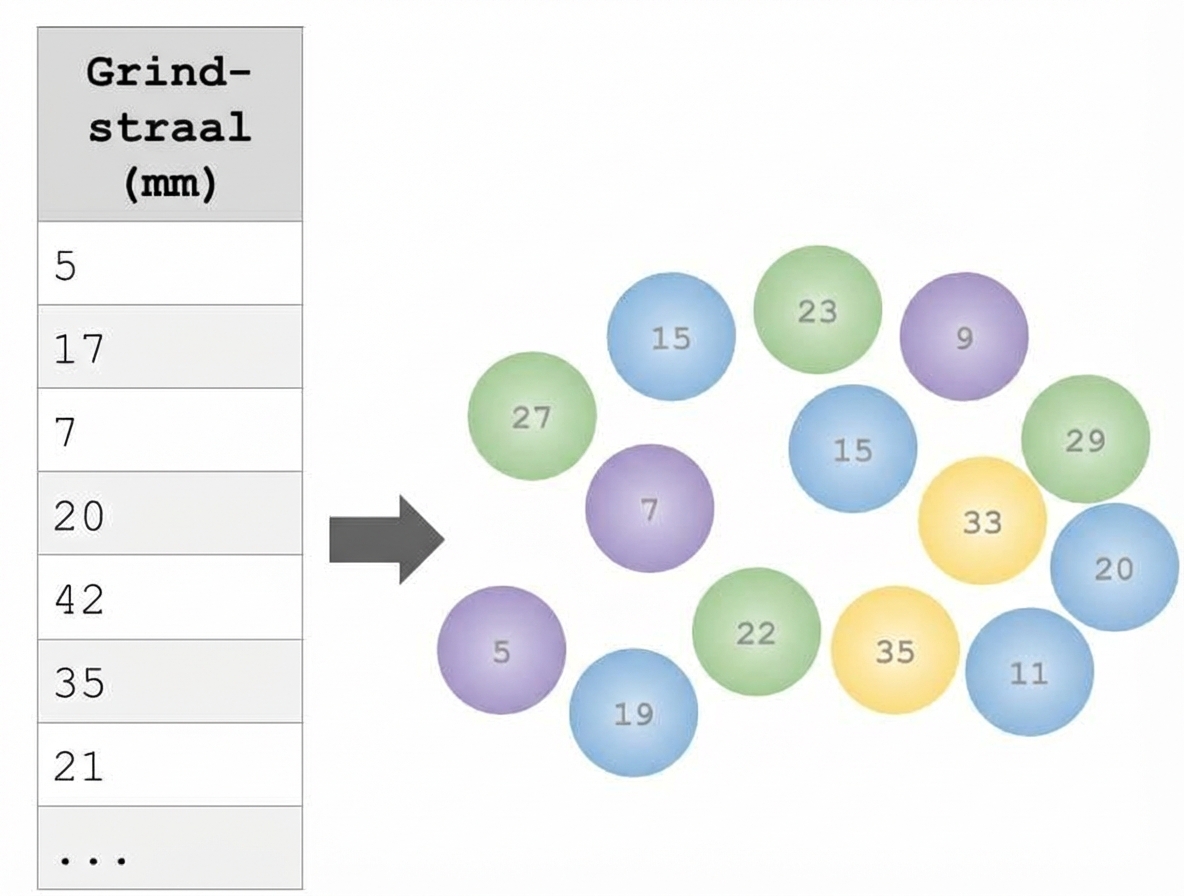
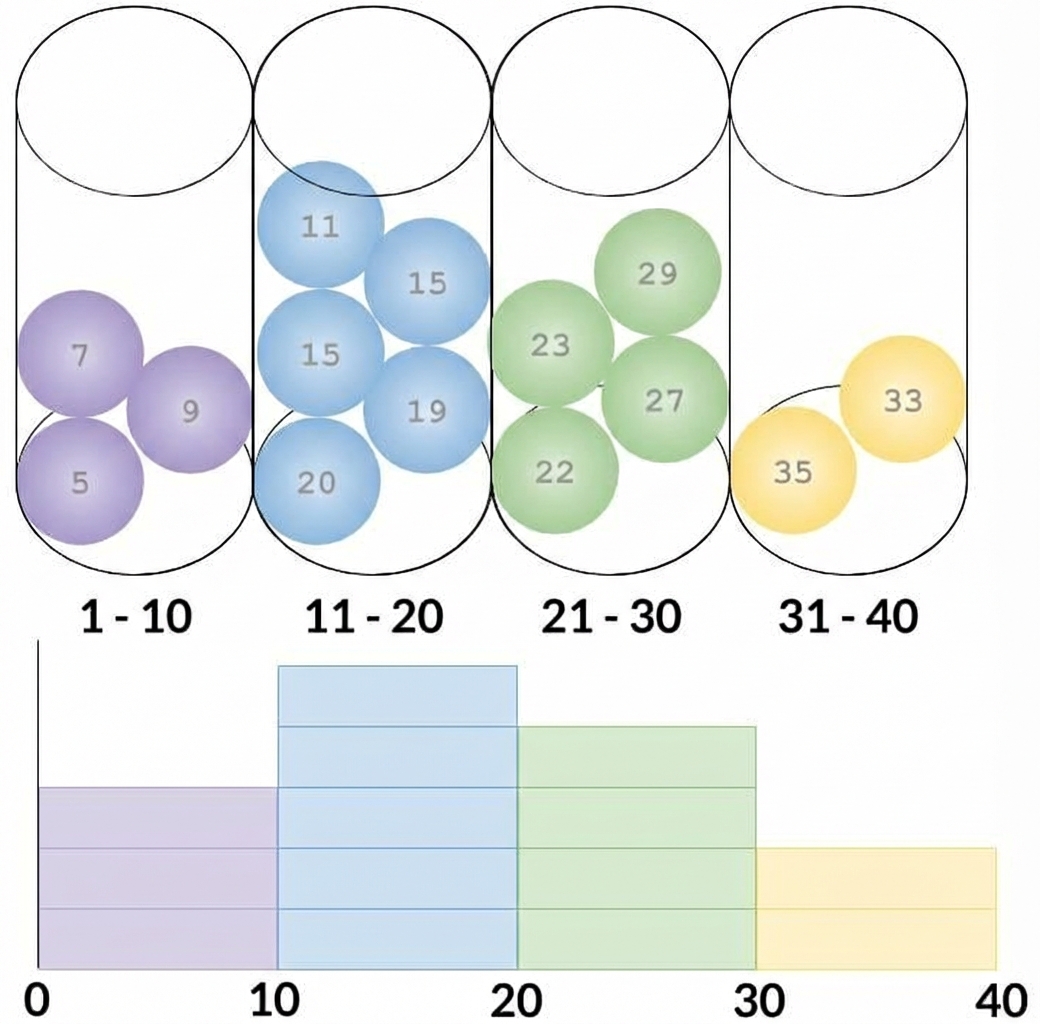
Wat is een histogram?
Histograms met matplotlib
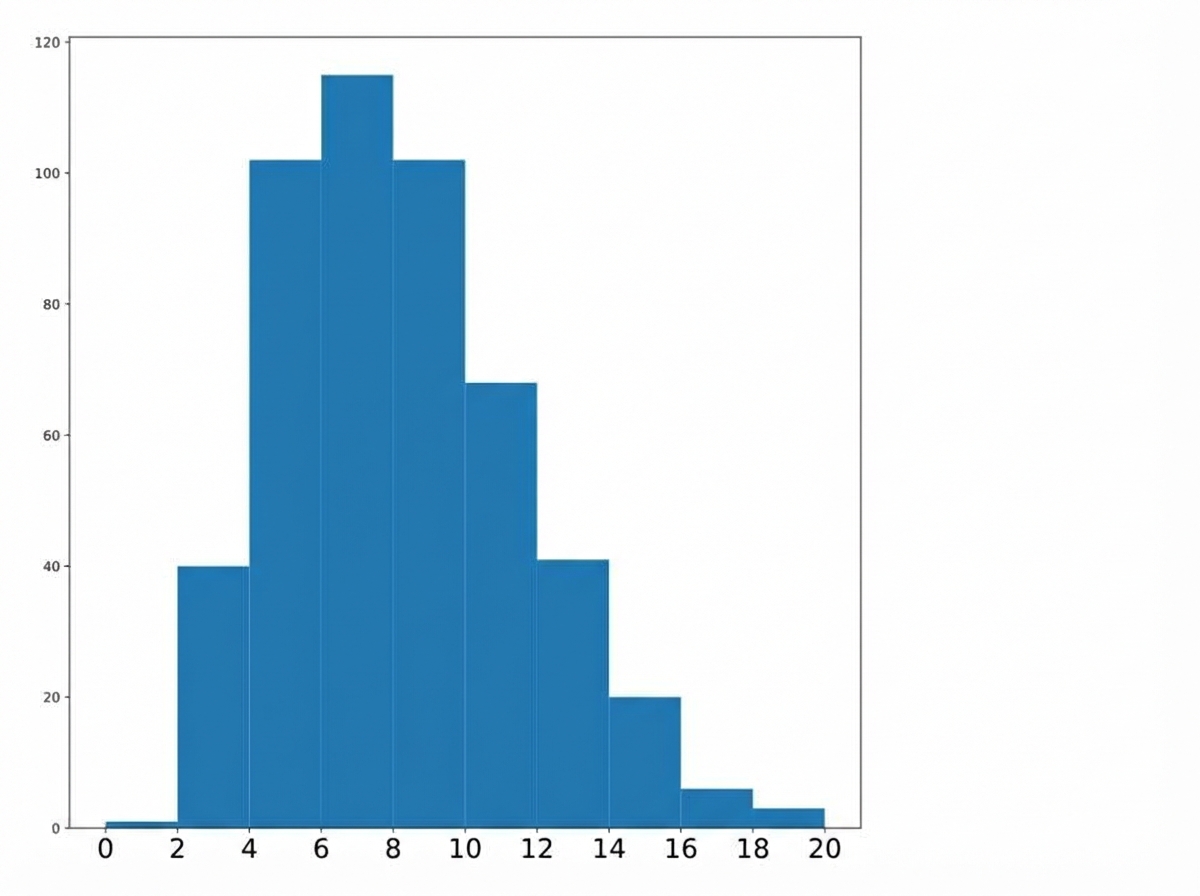
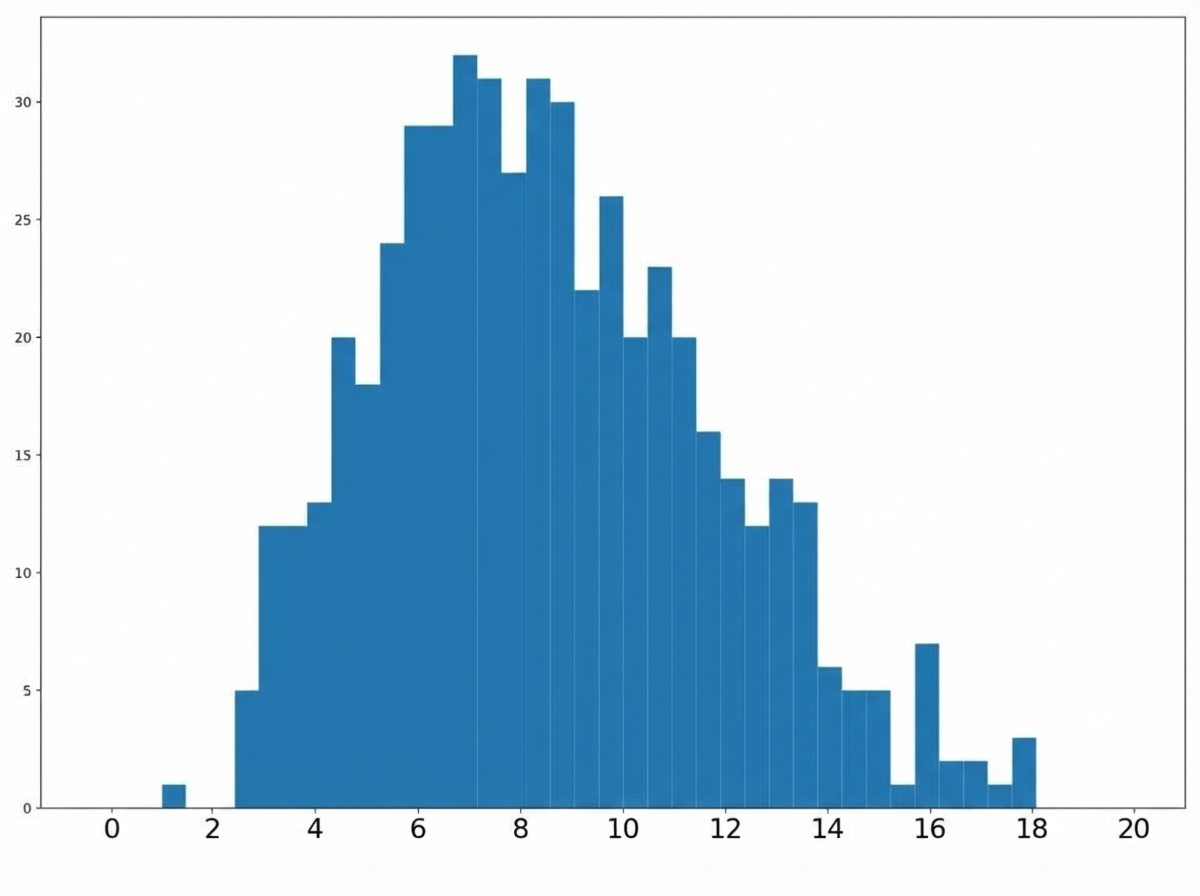
Bins aanpassen
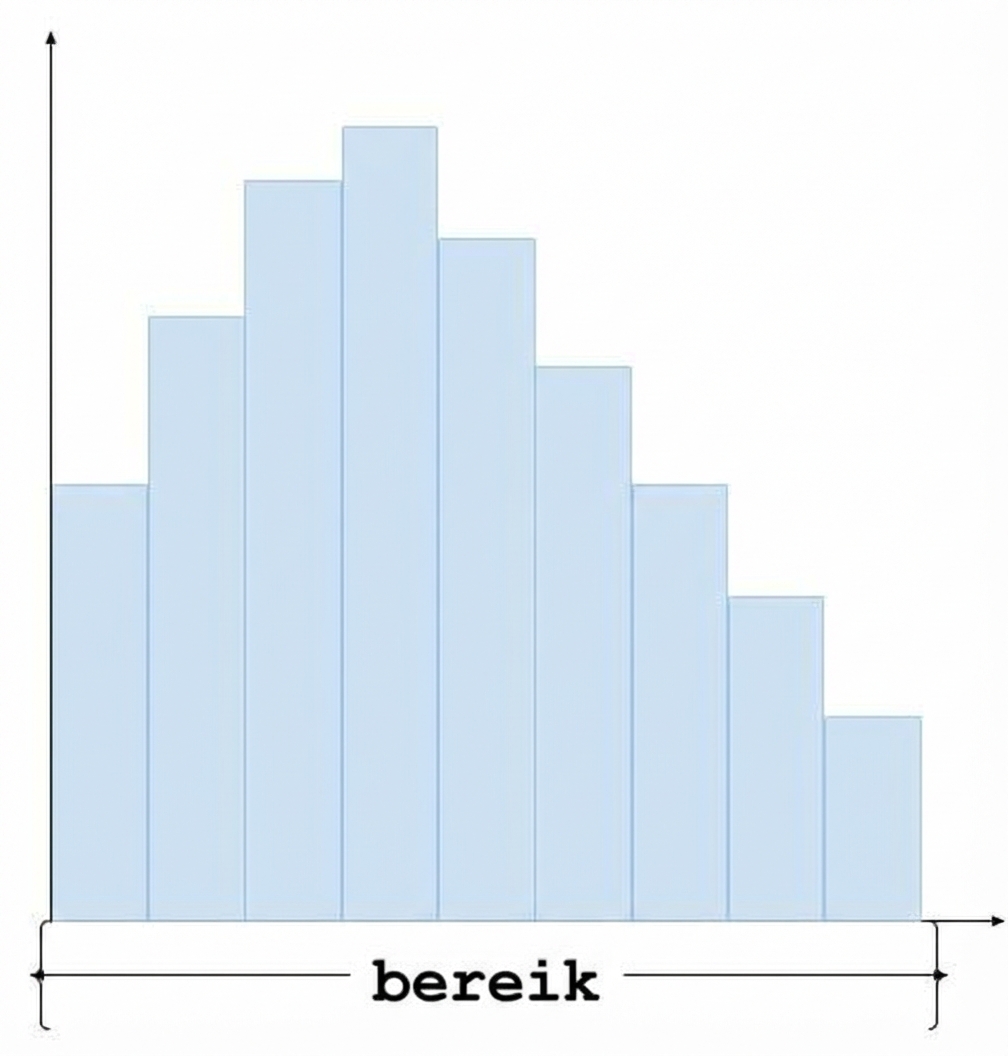
Bereik aanpassen
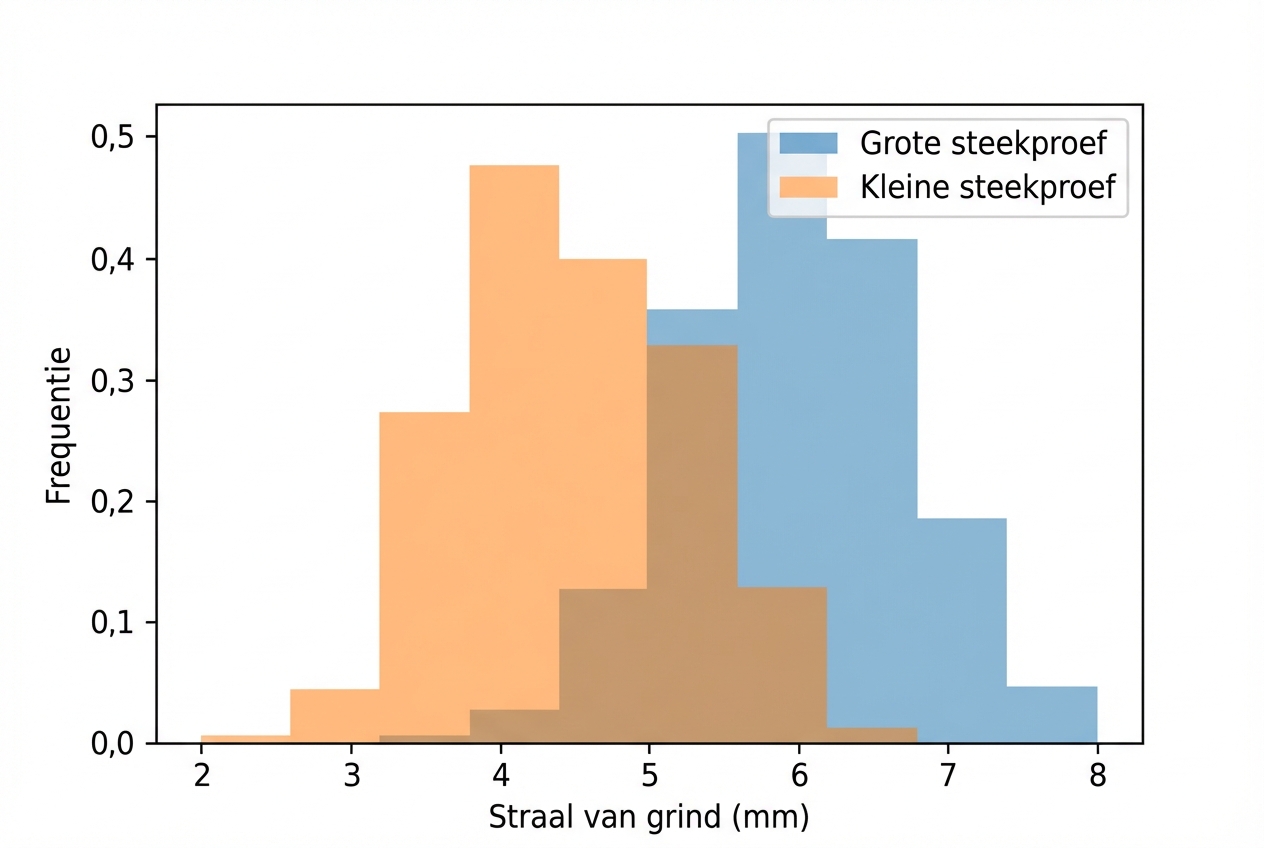
Normaliseren
Ongenormaliseerde staafdiagram
plt.hist(male_weight)
plt.hist(female_weight)
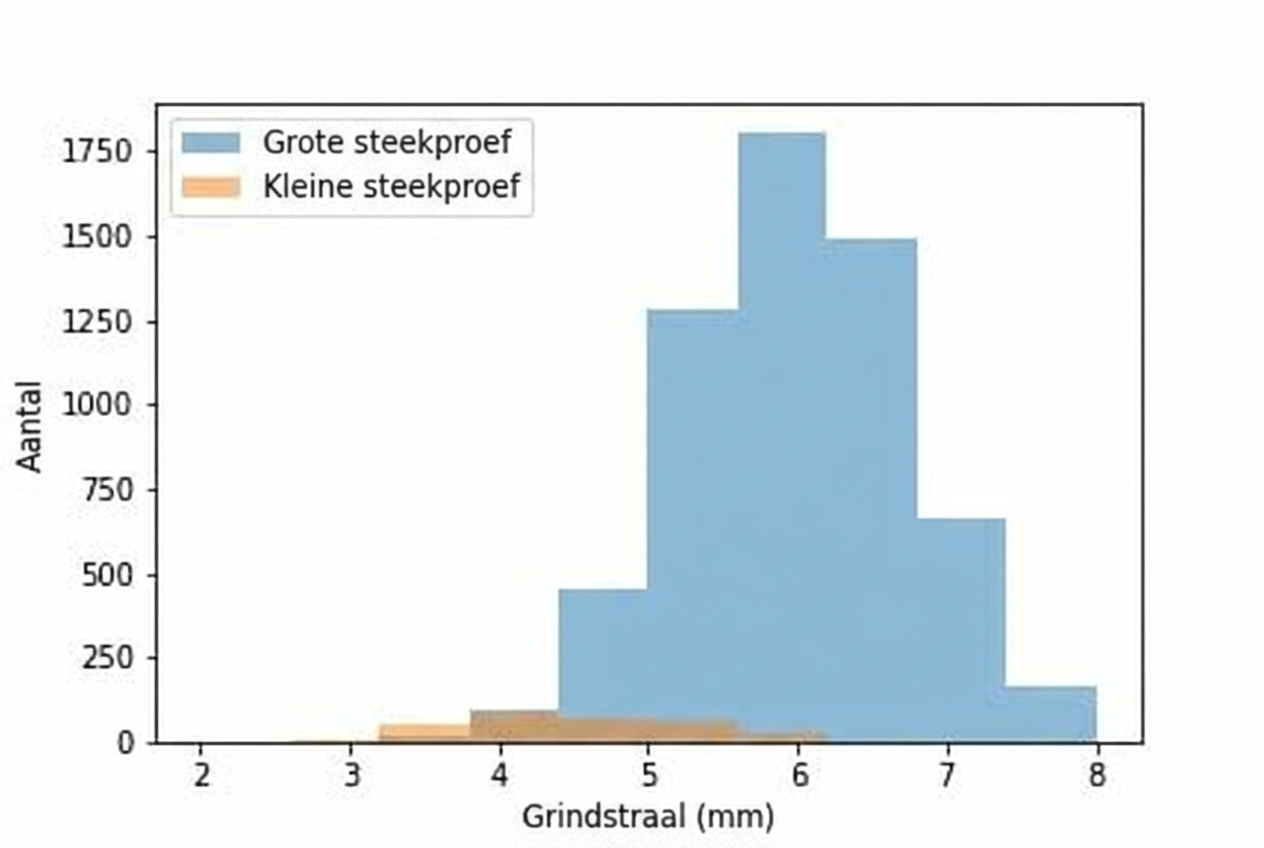
Som van staafoppervlakte = 1
plt.hist(male_weight, density=True)
plt.hist(female_weight, density=True)