When good data makes bad plots
Visualizzazione dei dati intermedia con ggplot2

Rick Scavetta
Founder, Scavetta Academy
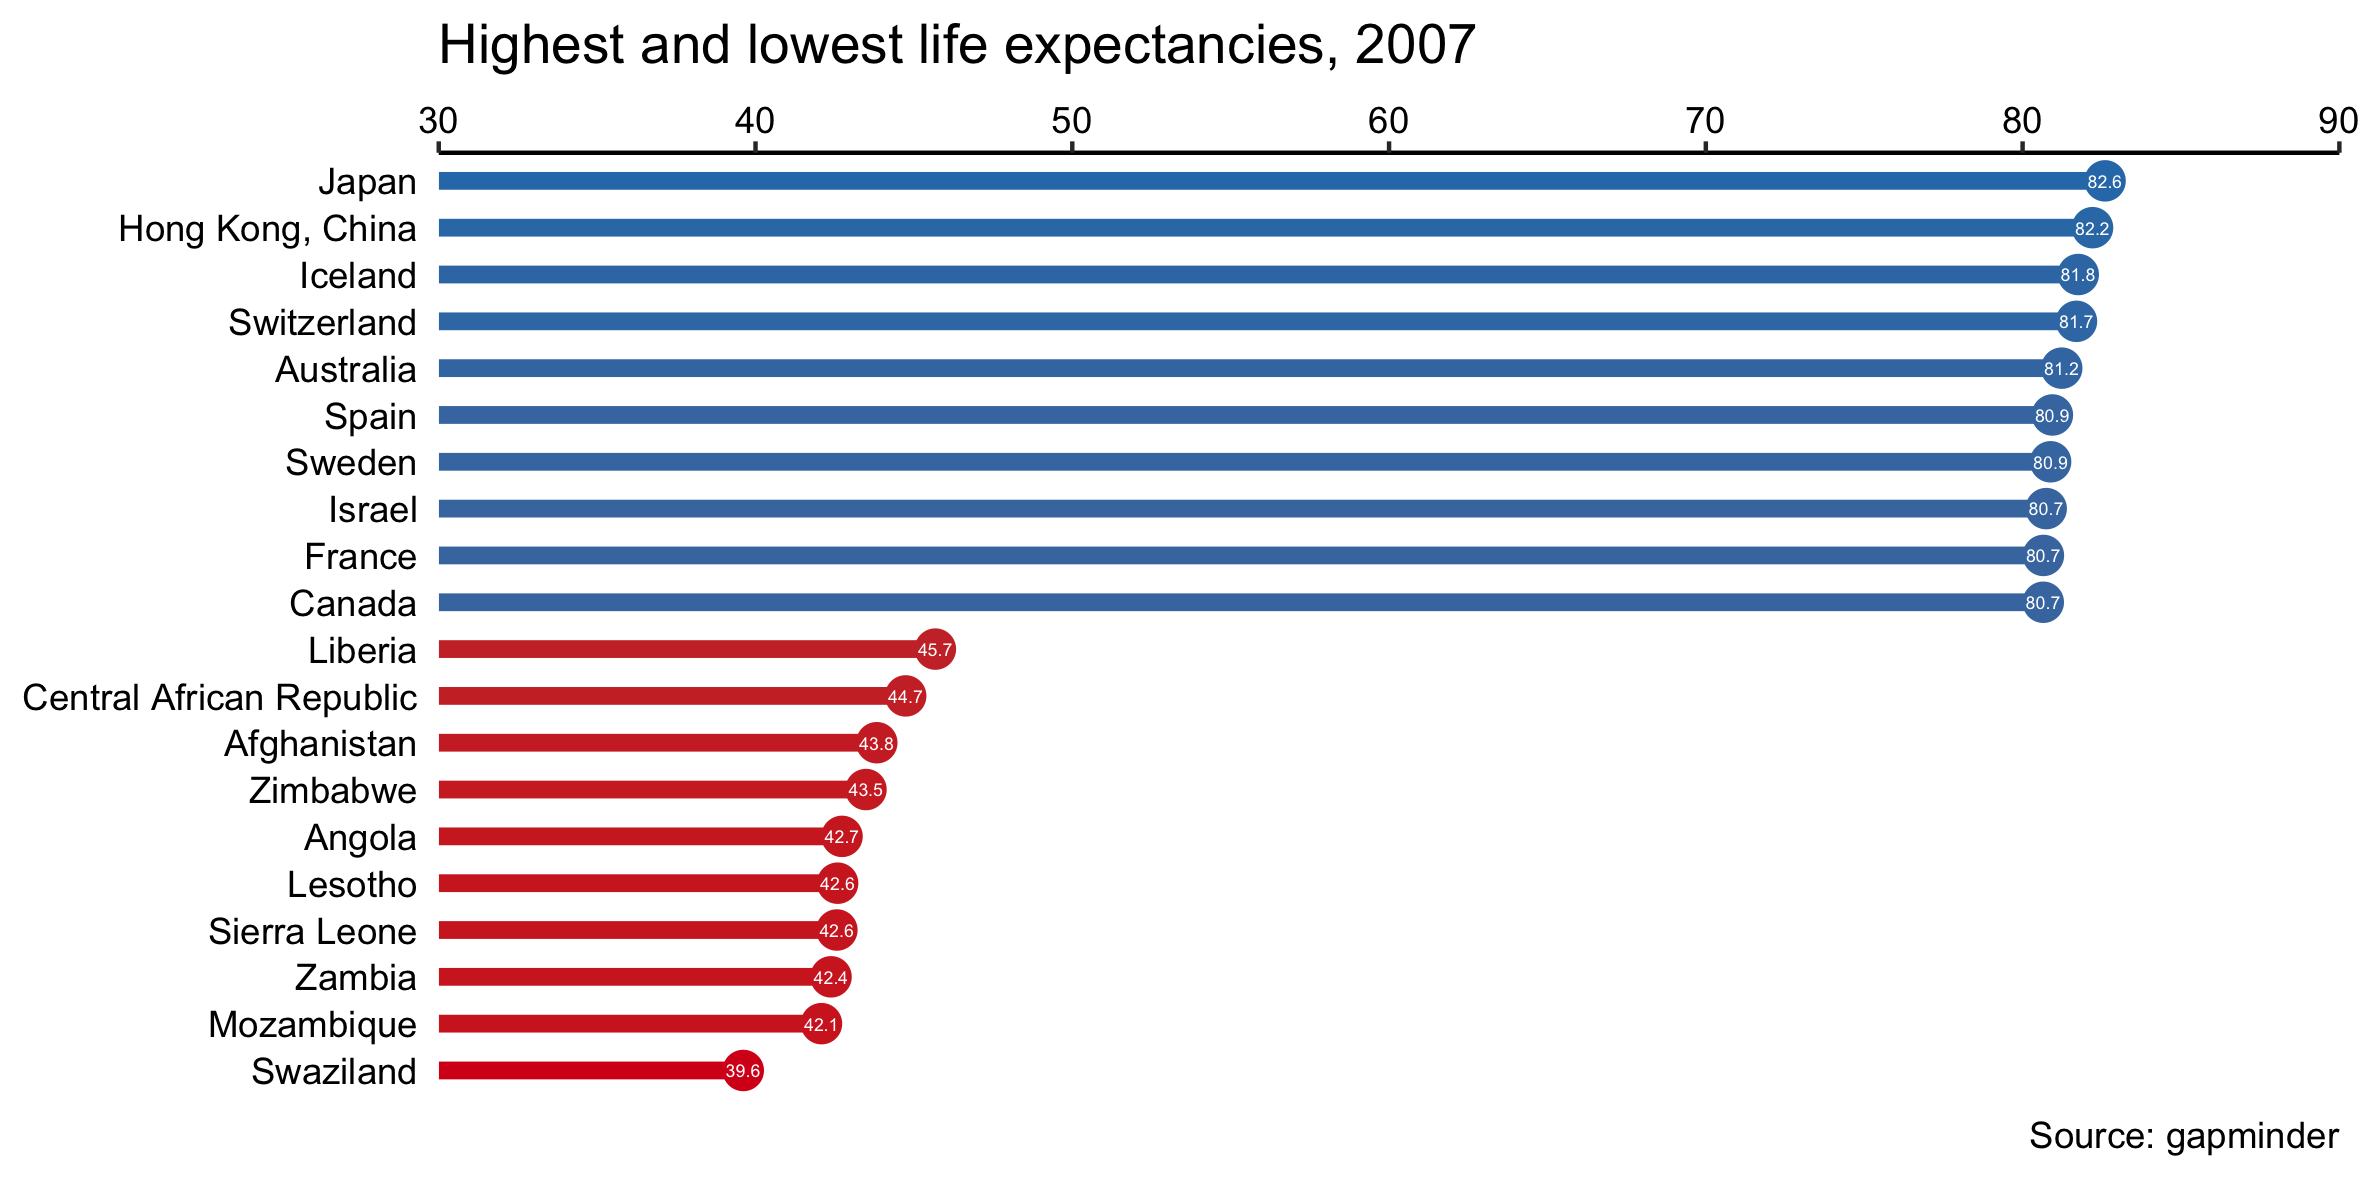
Wrong orientation
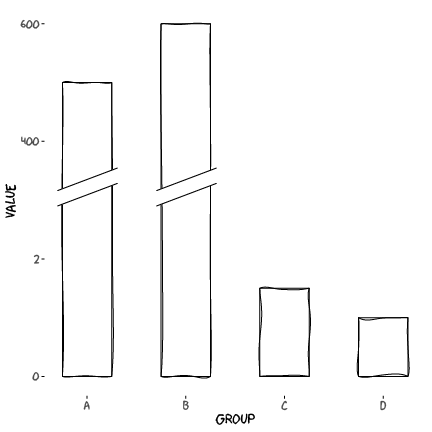
Broken y-axes
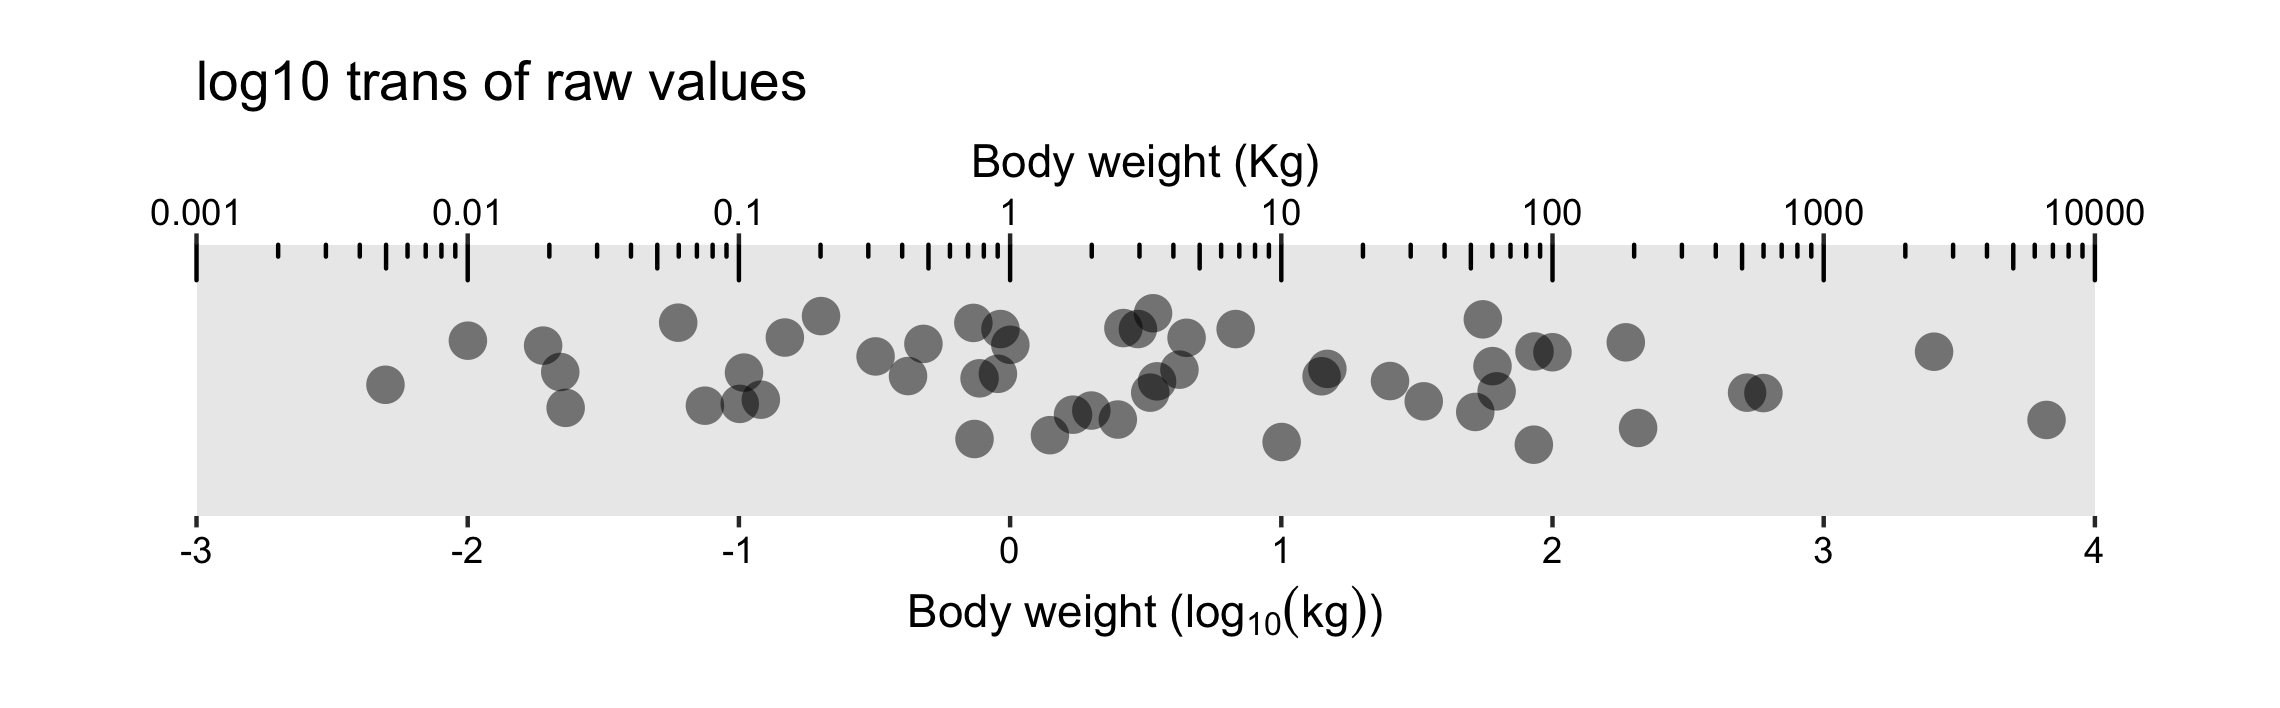
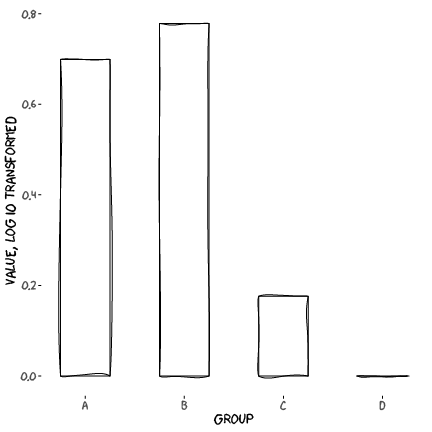
Broken y-axes, replace with transformed data
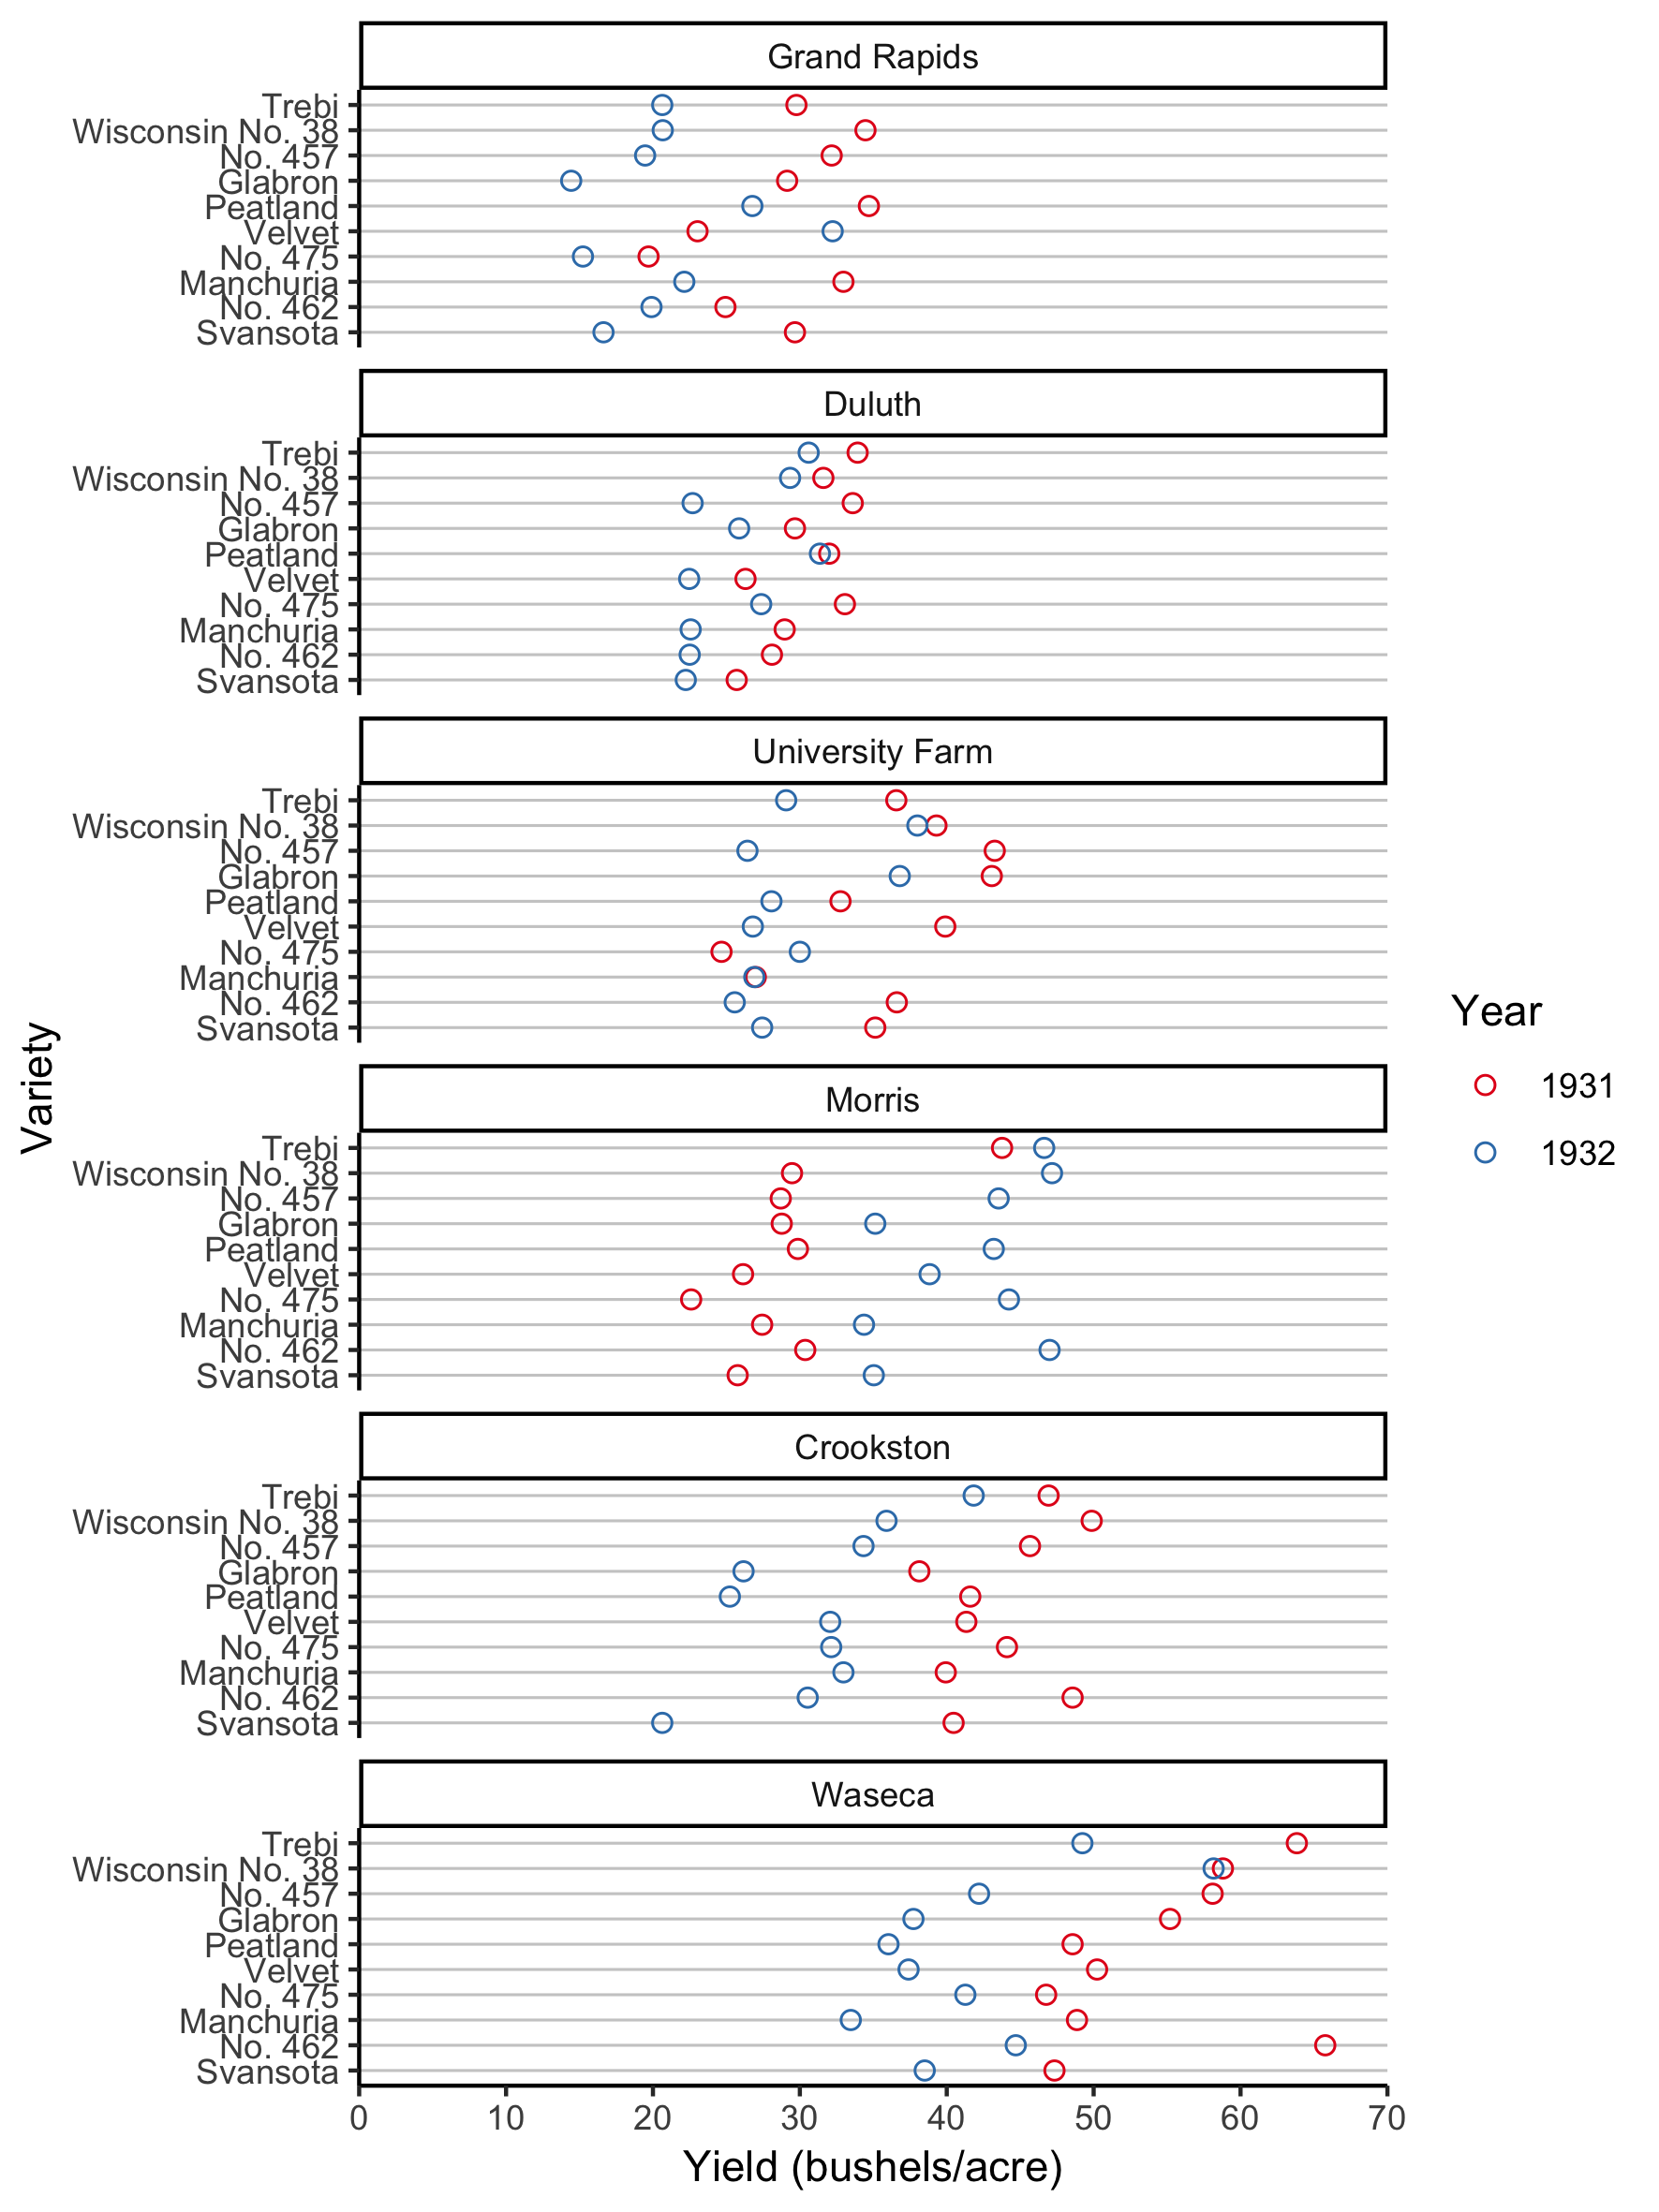
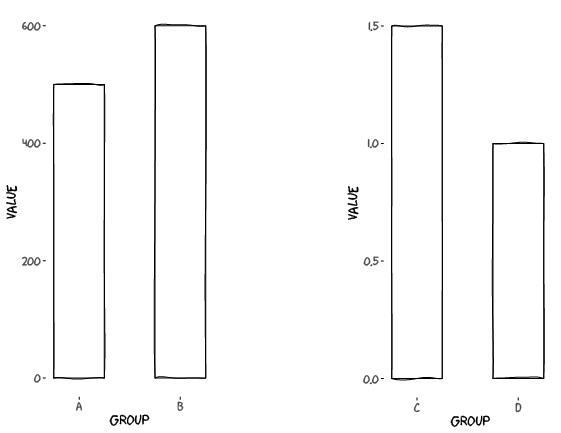
Broken y-axes, use facets
3D plots, without data on the 3rd axis

3D plots, with data on the 3rd axis
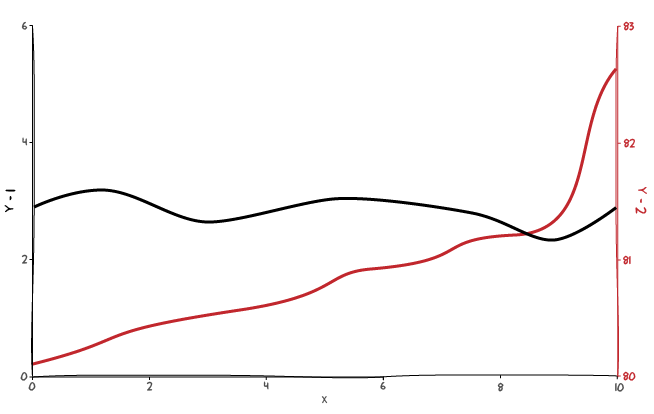
Double y-axes
Double y-axis for transformations