Dashboard-specific visualization techniques
Concetti di progettazione di dashboard

Olga Scrivner, PhD
President, Scrivner Solutions Inc
Designing dashboards for human eyes

well designed data graphics are usually the simplest and [...] the most powerful${^1}$
Design principles
Processing information
Design principles
Processing information
Design principles
Processing information
Dashboard design principles
Design principles
Processing information
Dashboard design principles
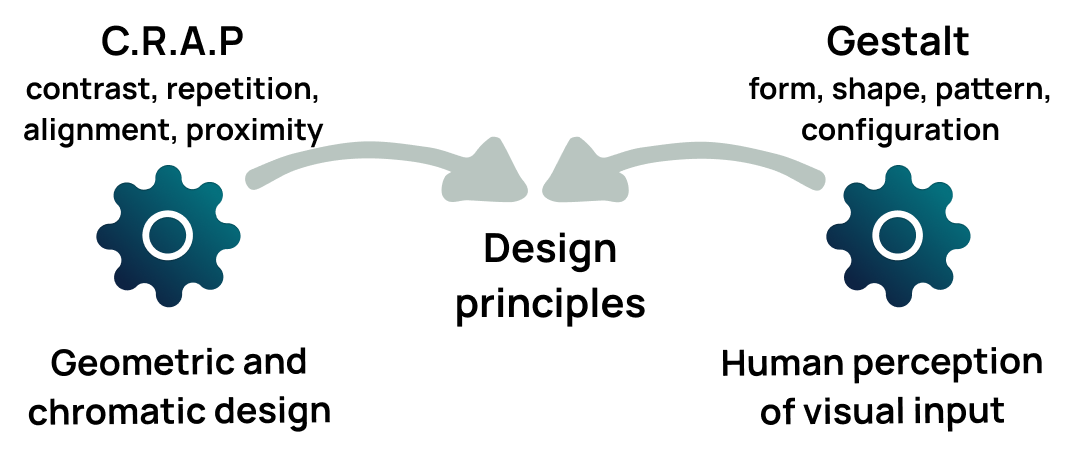
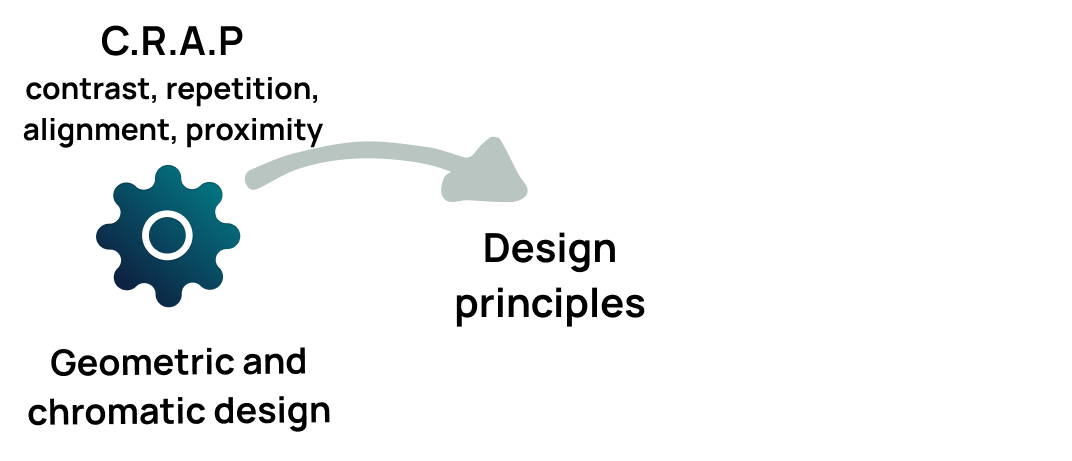
C.R.A.P. design principles
Contrast
- Color, size, shape
Repetition
- The "rhythm" of the dashboard reading
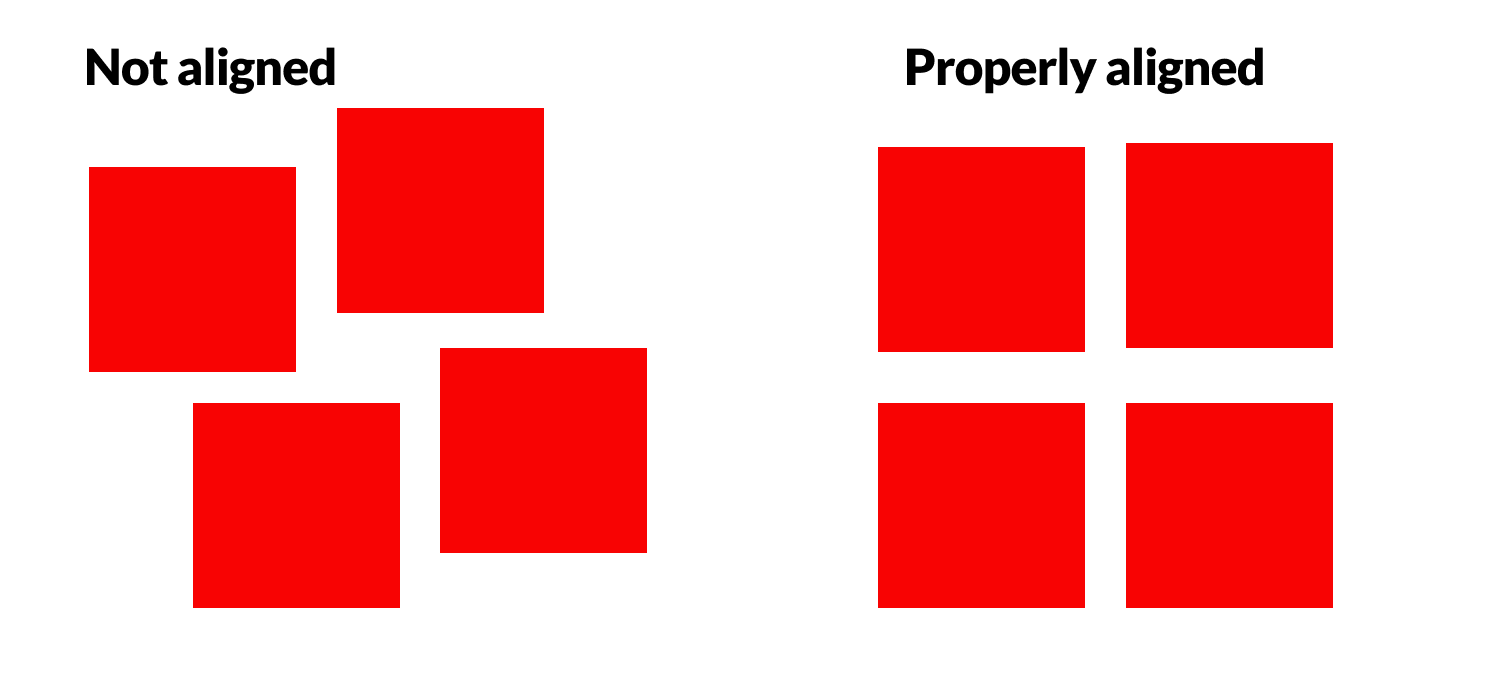
Alignment
- An ordered design
Proximity
- Related elements must be grouped

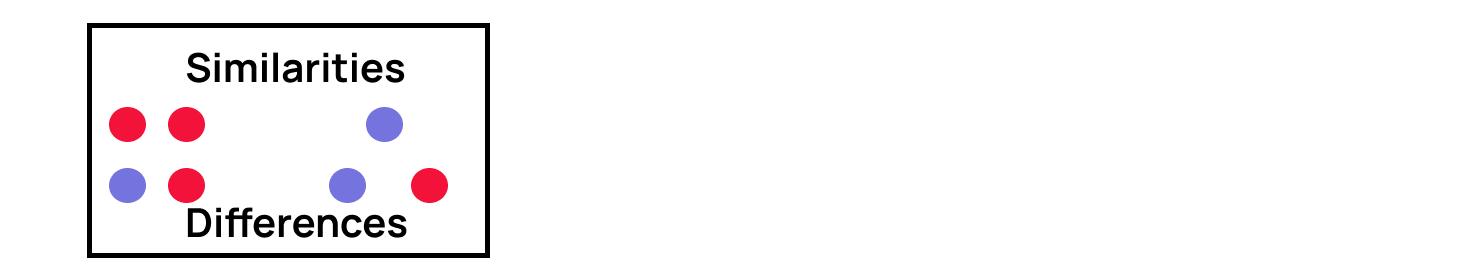
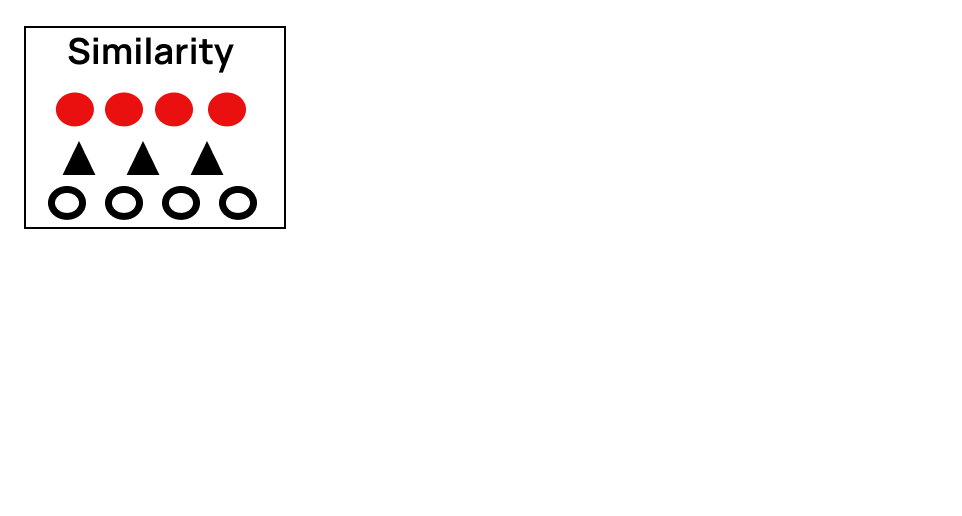
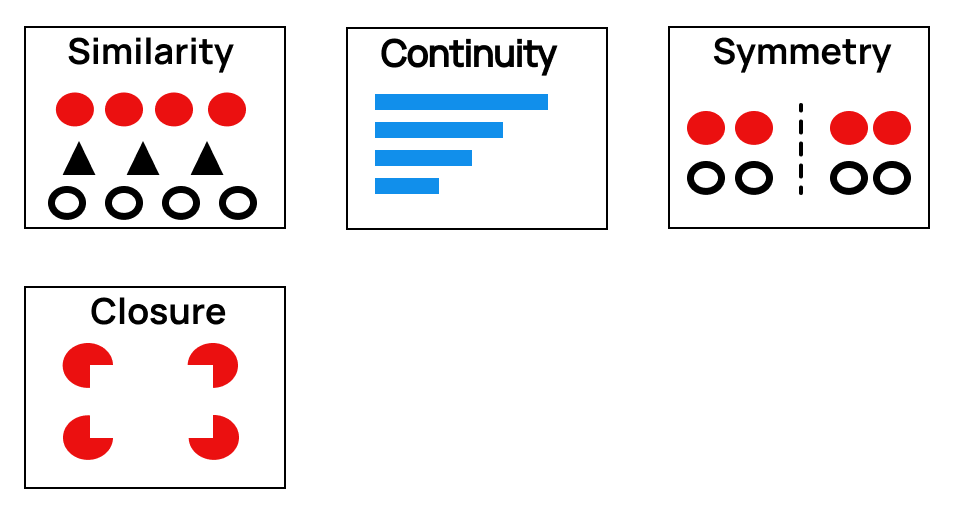
Gestalt principles
How we perceive and organize what we see in particular ways in an effort to make sense of it.
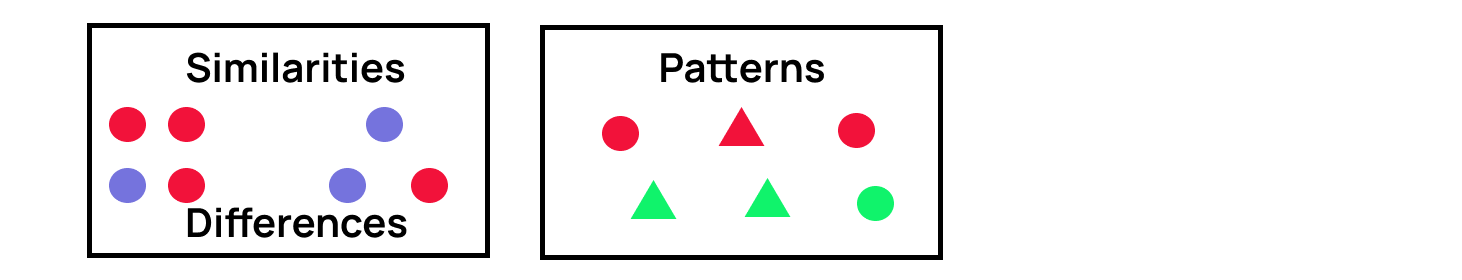
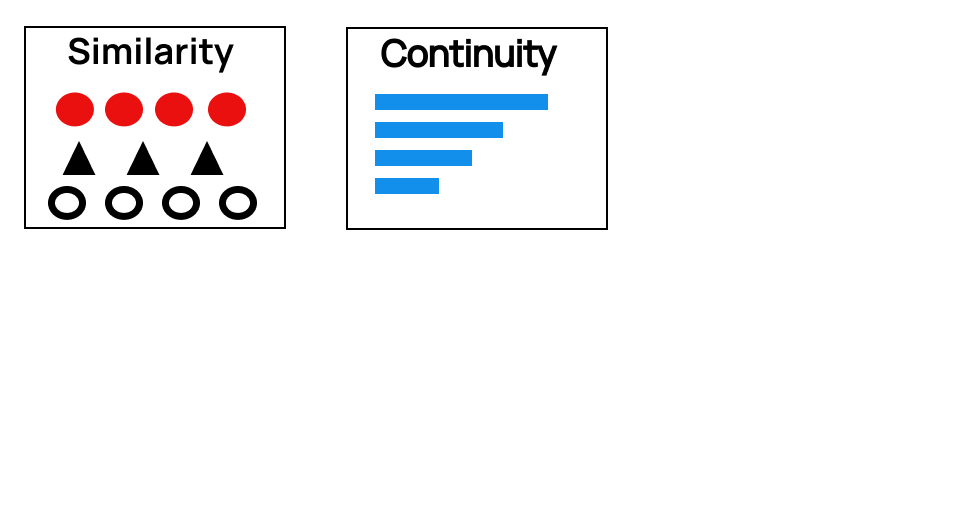
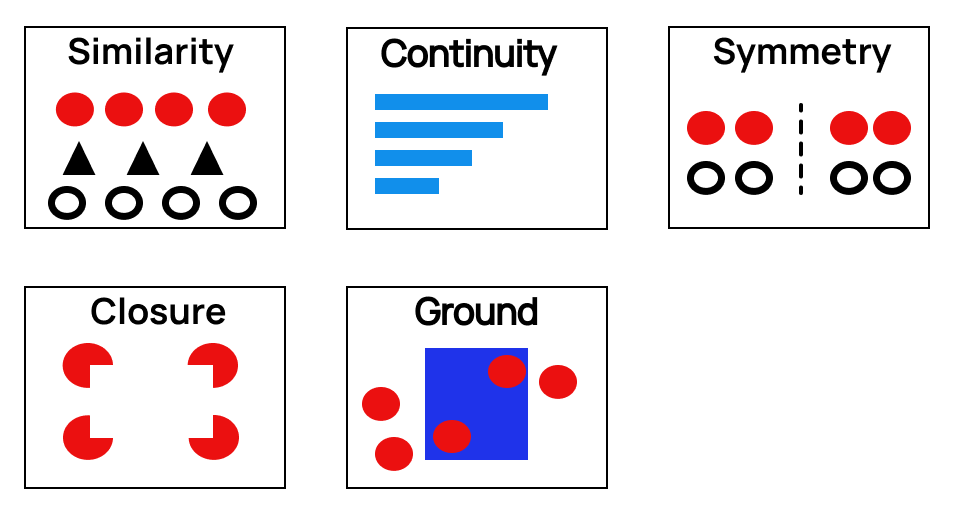
Gestalt principles
How we perceive and organize what we see in particular ways in an effort to make sense of it.
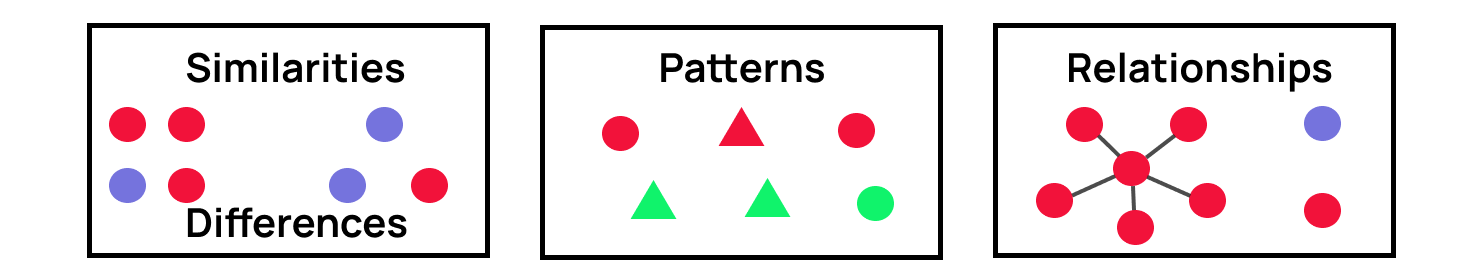
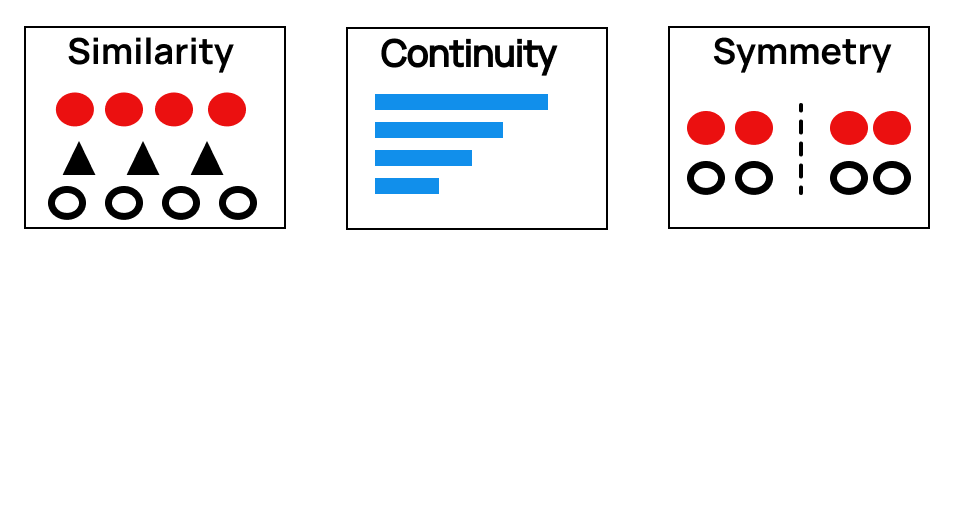
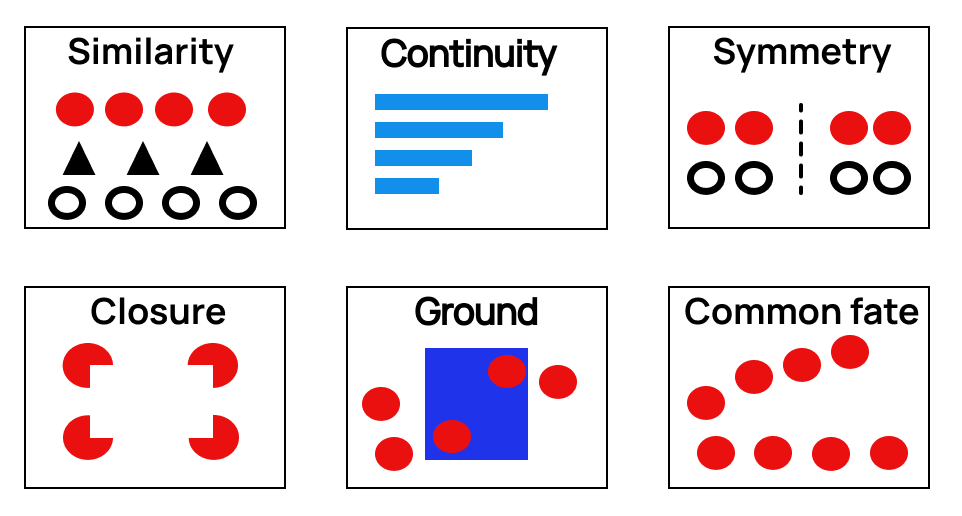
Gestalt principles
How we perceive and organize what we see in particular ways in an effort to make sense of it.
Gestalt principles
How we perceive and organize what we see in particular ways in an effort to make sense of it.
Gestalt principles
How we perceive and organize what we see in particular ways in an effort to make sense of it.
Gestalt principles
How we perceive and organize what we see in particular ways in an effort to make sense of it.
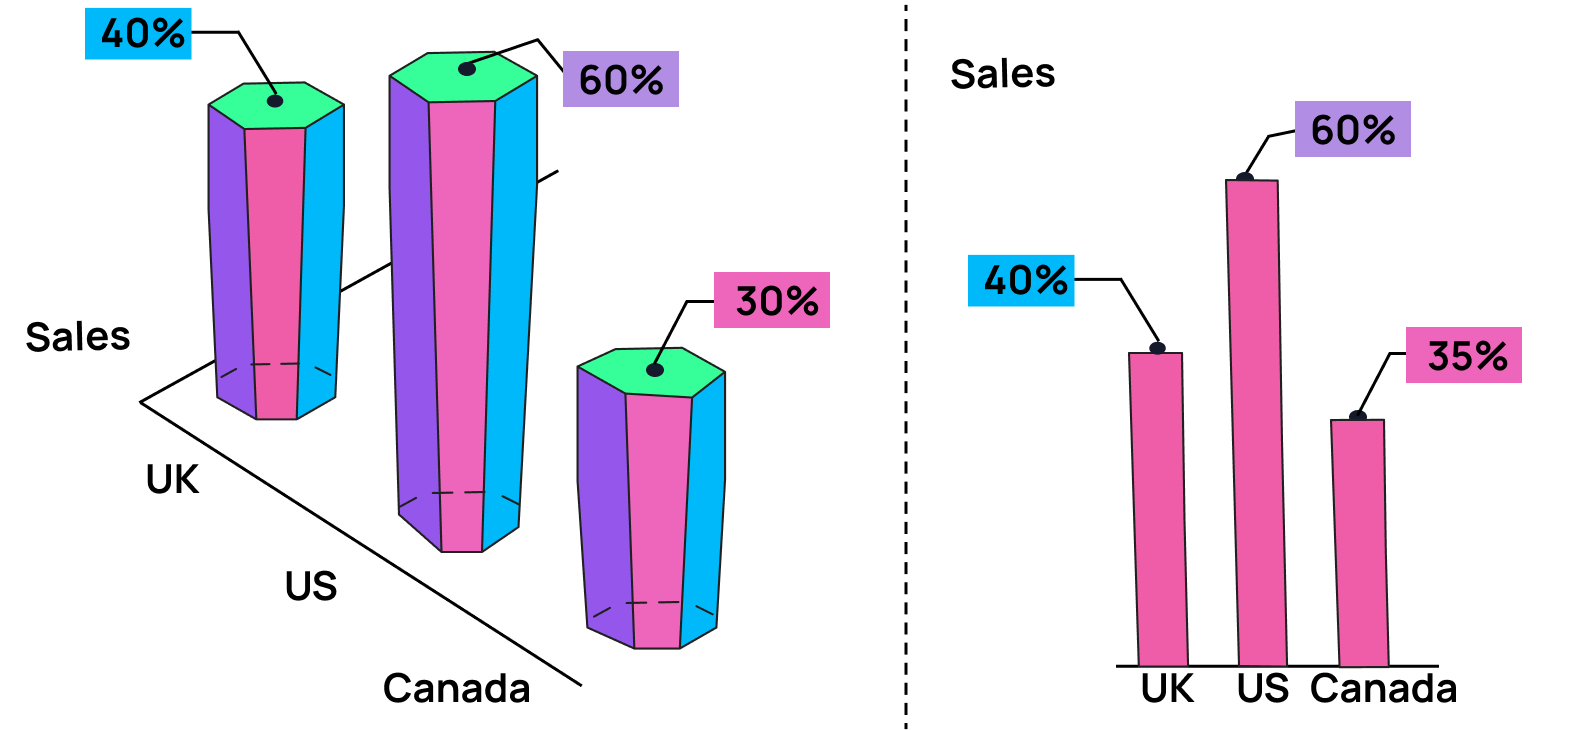
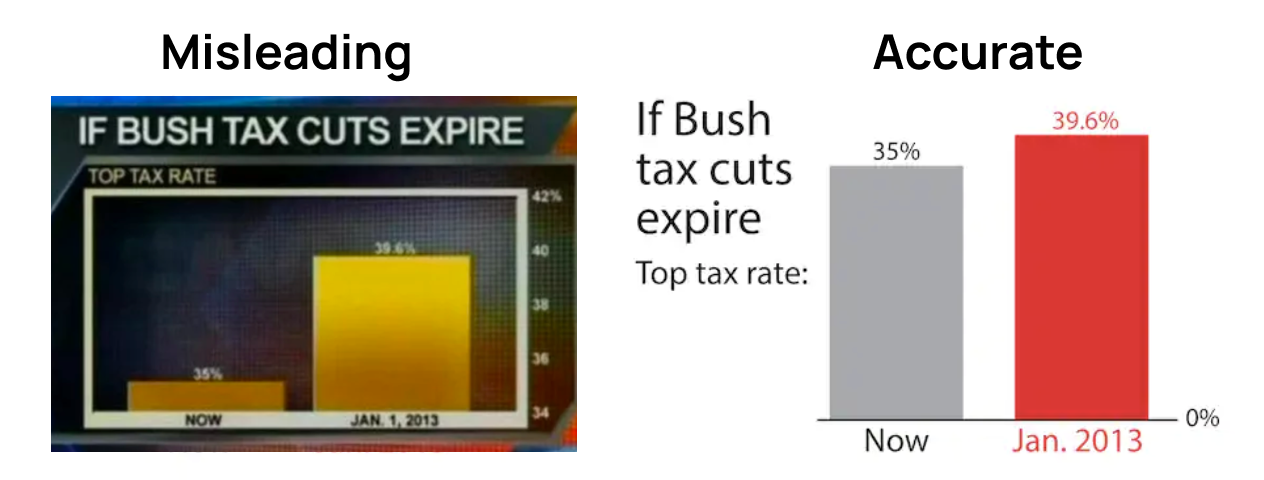
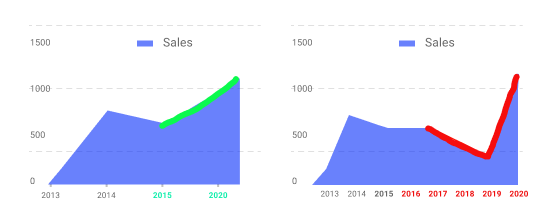
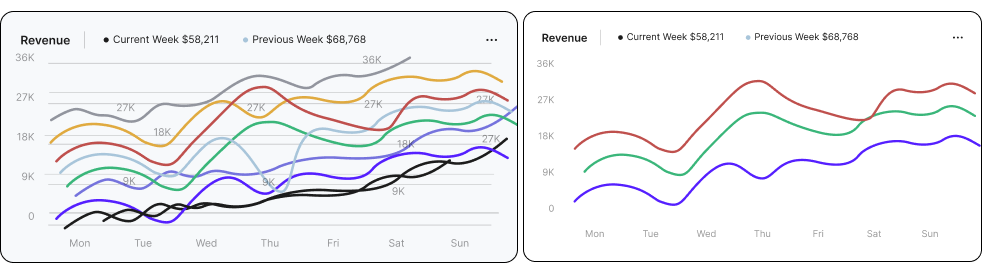
Misleading visualization: dos and don'ts
Non-zero baseline
Interval inconsistency
Overload
3D effects