Visualizzare e comunicare le tue insight
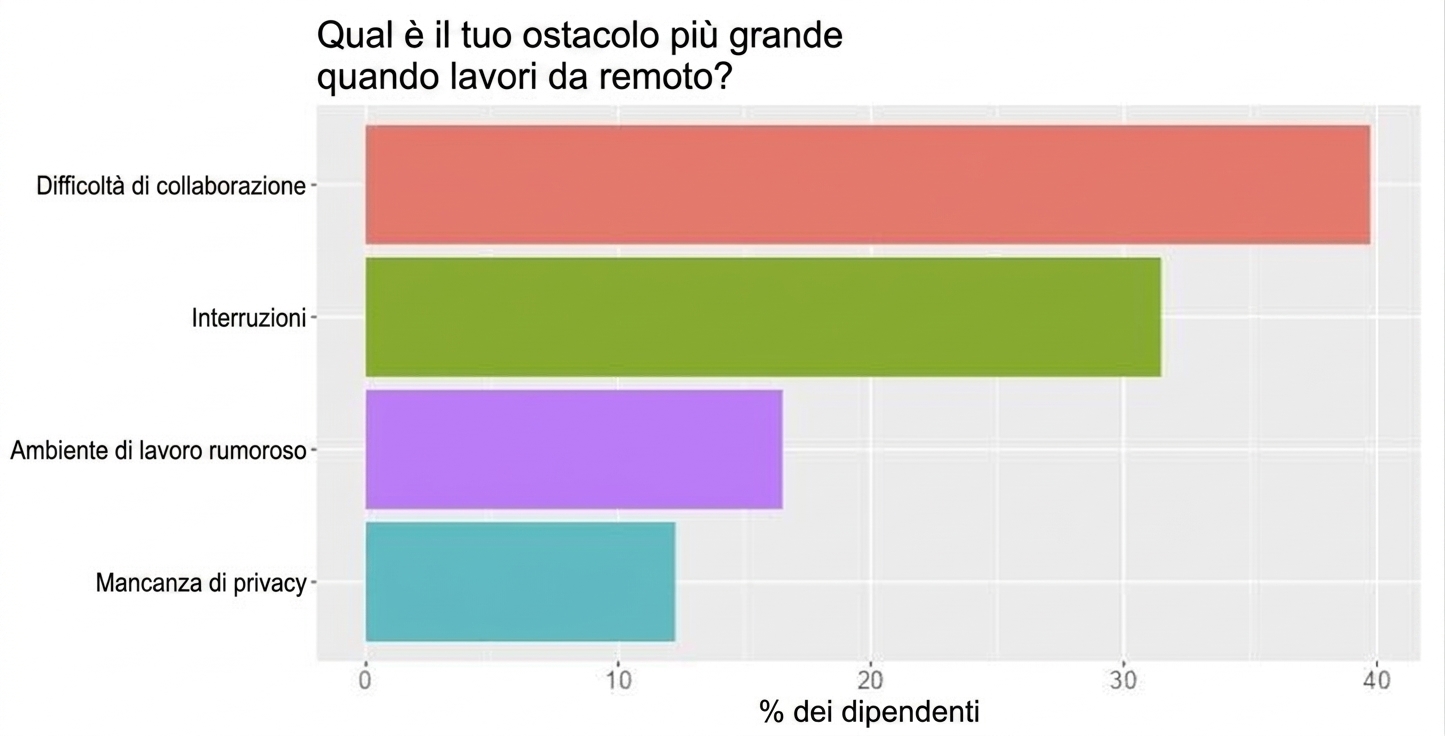
Case study di Data Literacy: analisi del lavoro da remoto

Maarten Van den Broeck
Senior Content Developer at DataCamp
Un’immagine vale più di mille parole
Cose da considerare quando comunichi le tue insight

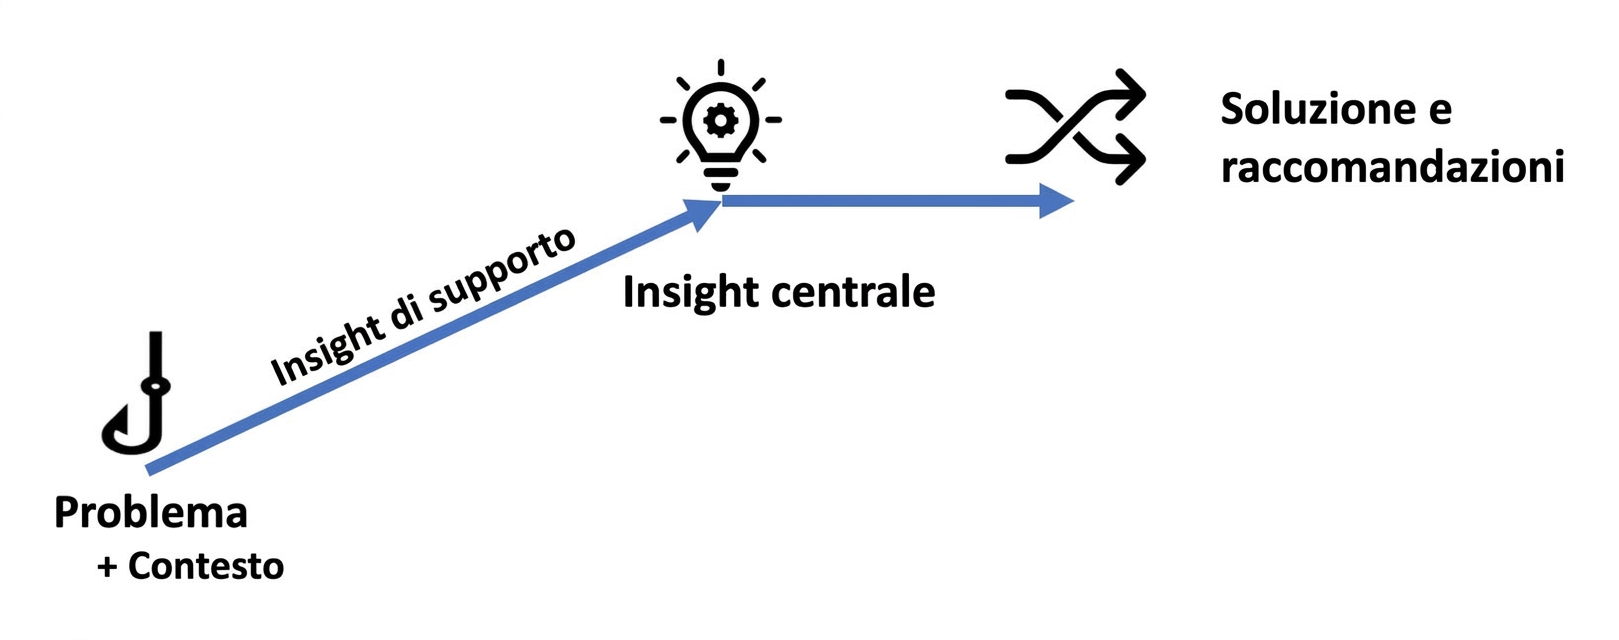
Usa una struttura narrativa
Sostieni le insight con visualizzazioni