Esplorare i dati
Case study di Data Literacy: analisi del lavoro da remoto

Maarten Van den Broeck
Senior Content Developer at DataCamp
Analisi esplorativa dei dati

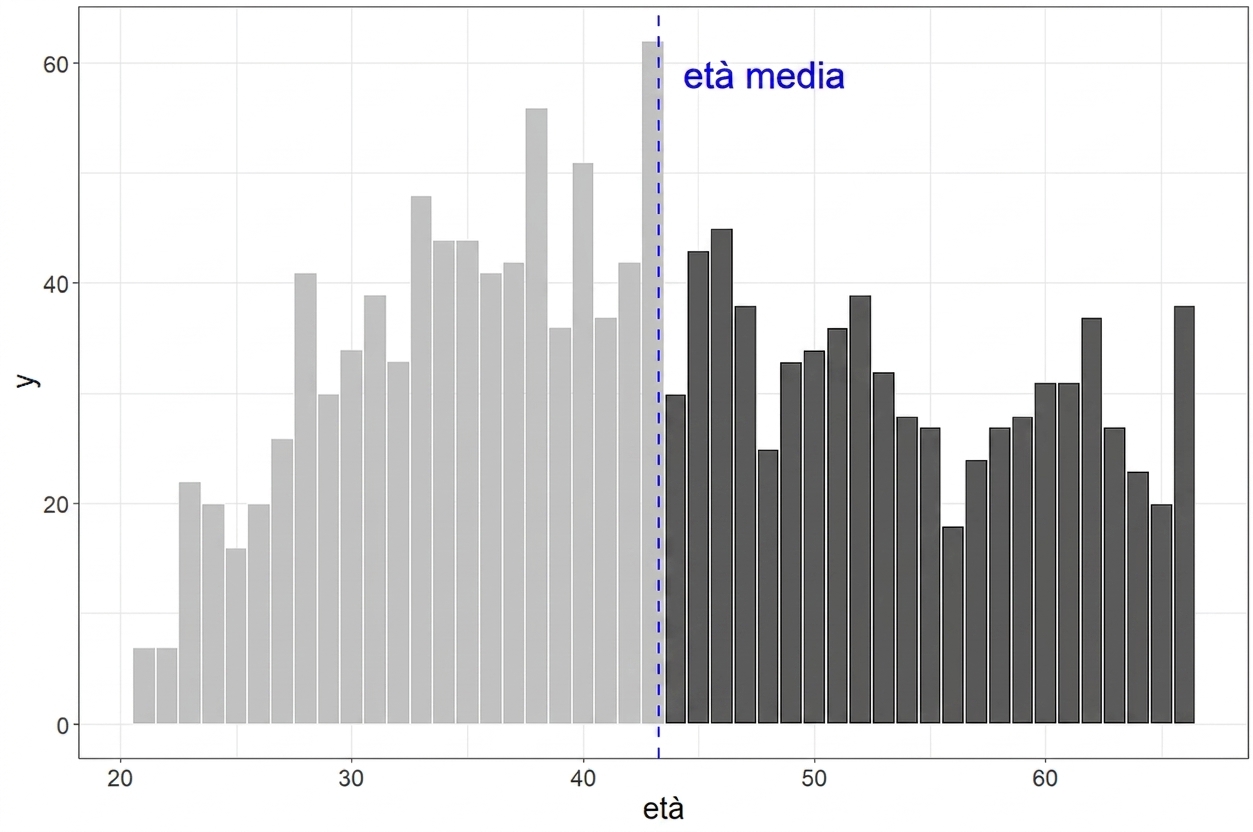
Tutte le fasce d’età sono rappresentate?
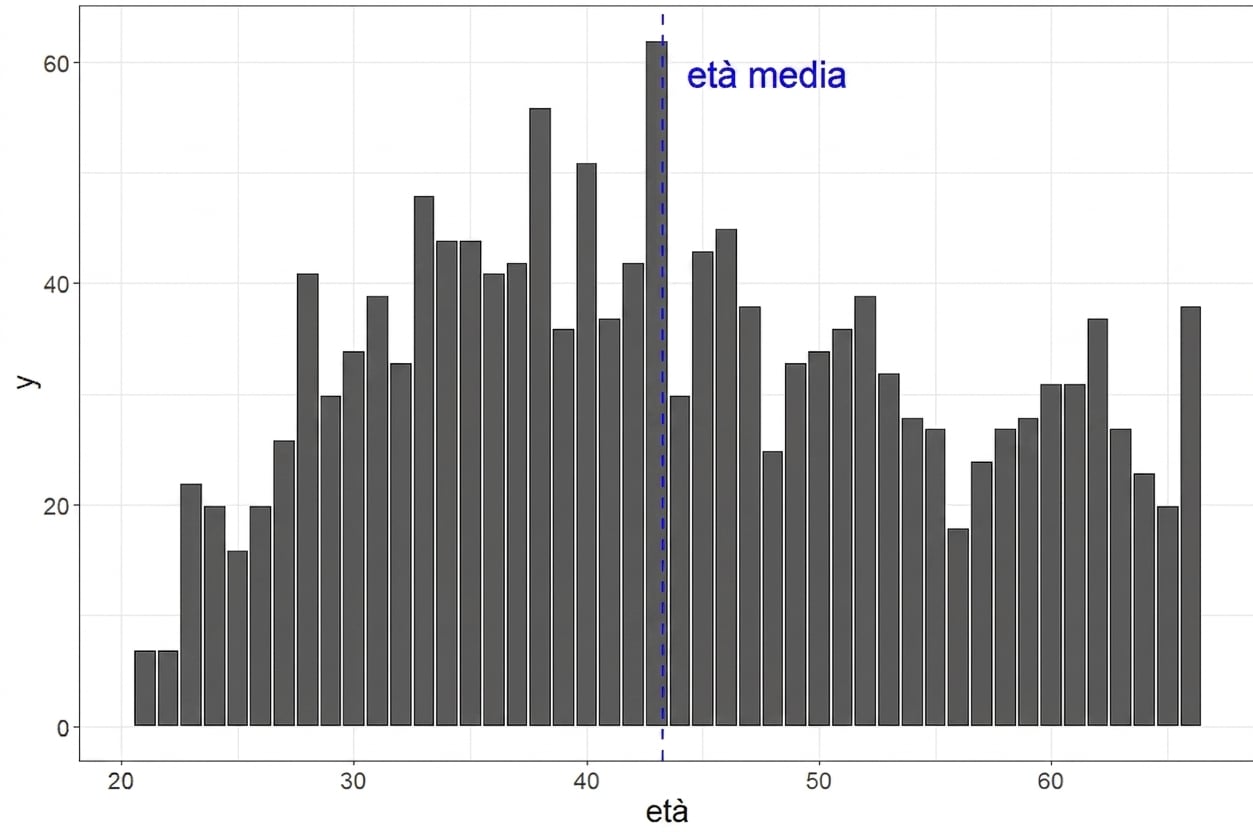
Tutte le fasce d’età sono rappresentate?
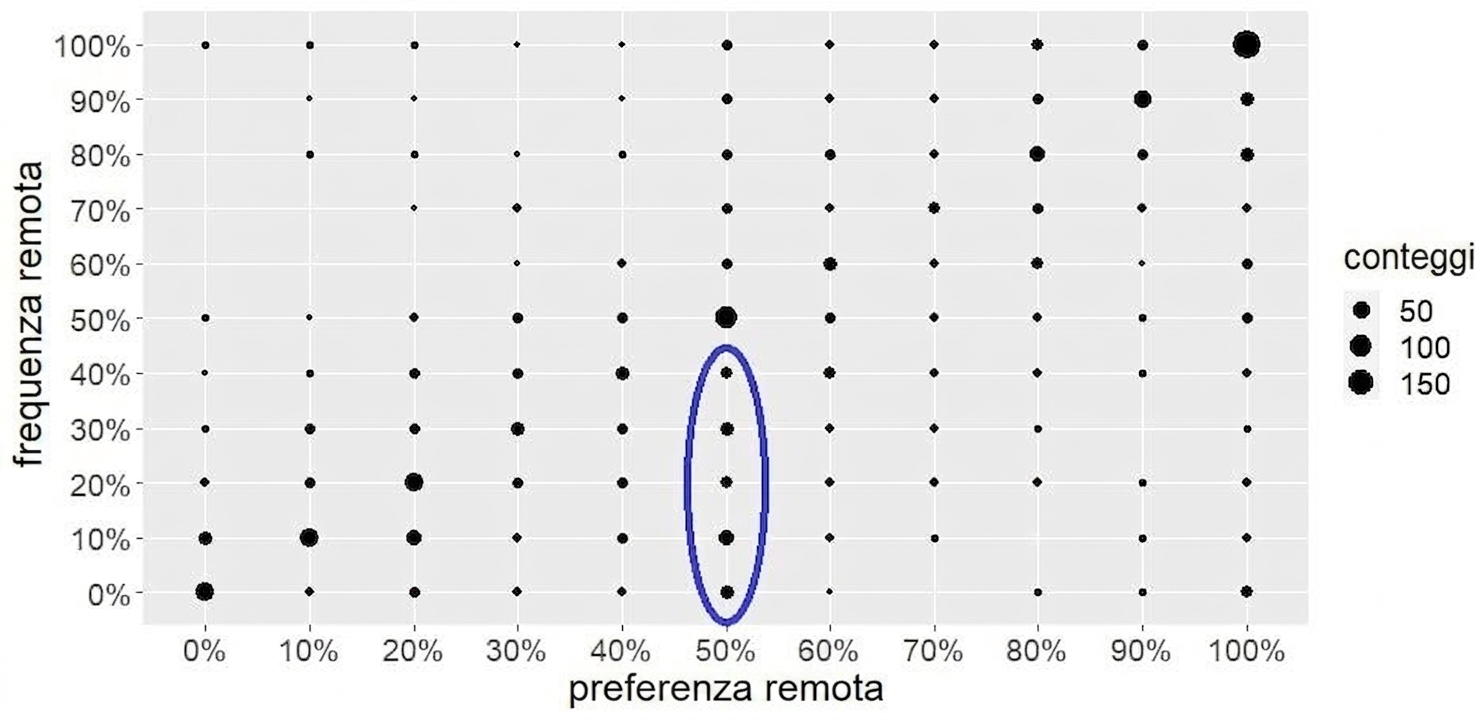
Esempio: frequenza remoto vs preferenza
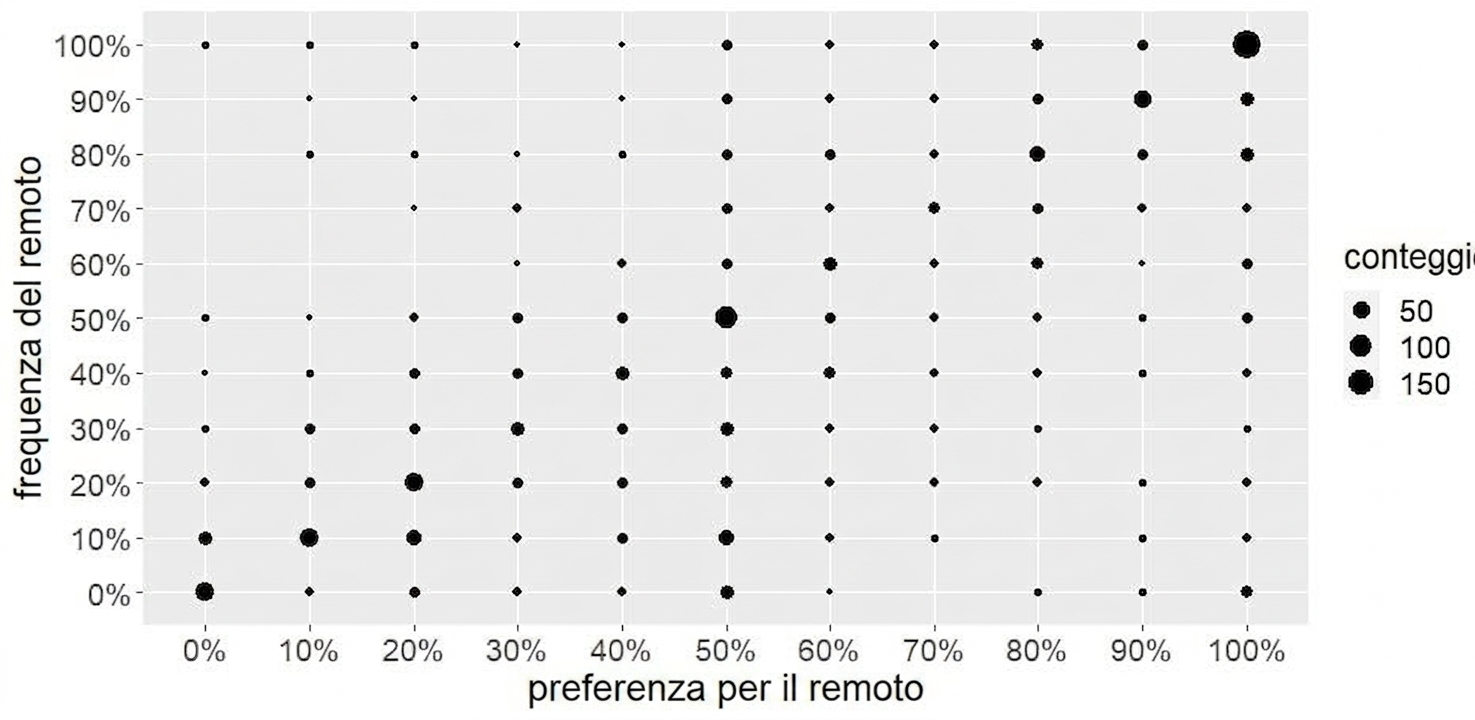
Esempio: frequenza remoto vs preferenza
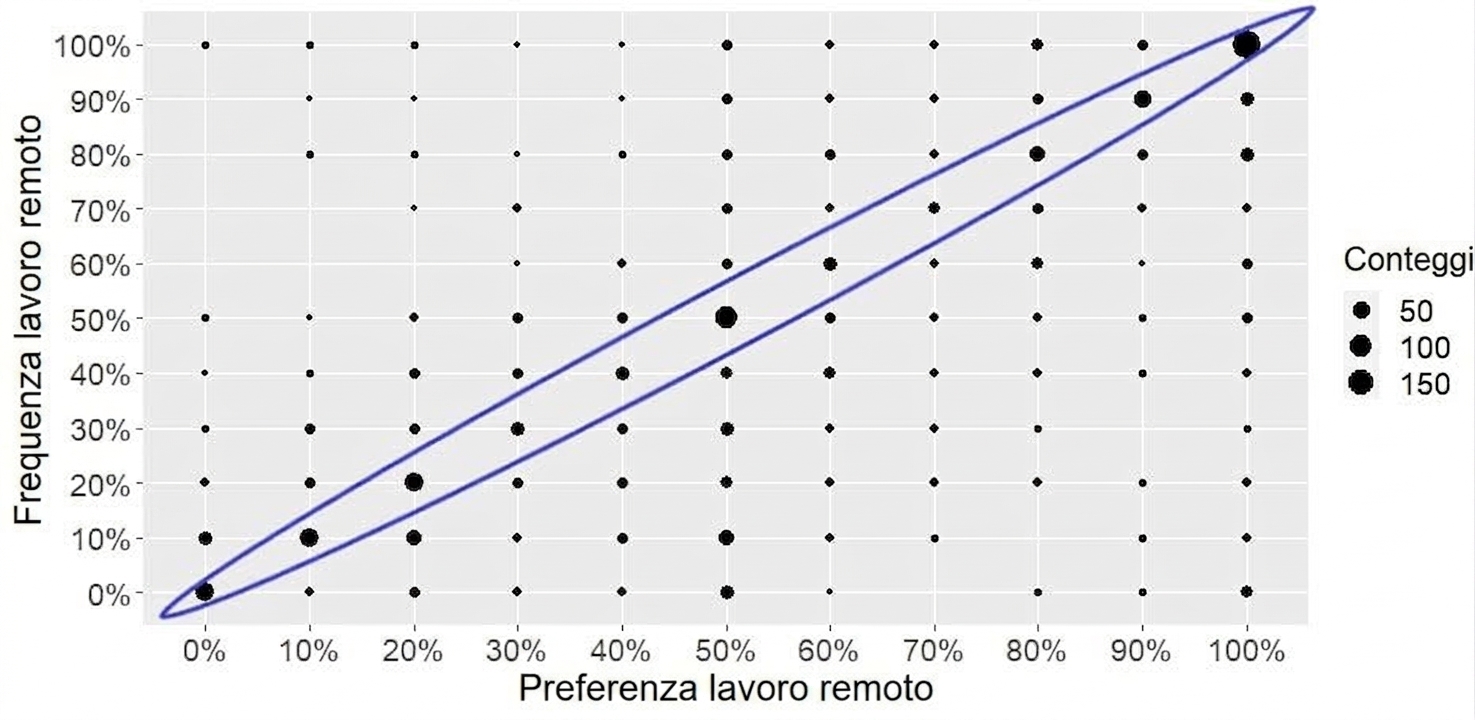
Esempio: frequenza remoto vs preferenza