Modeling grain yields

Introduzione alla scrittura di funzioni in R

Richie Cotton

Data Evangelist at DataCamp

It's the faceted time series of corn yields that you drew in the previous exercise. There are nine panels, one for each census region. In each panel, yields increase slowly until about 1950, then increase rapidly after that.

Introduzione alla scrittura di funzioni in R

Linear models vs. generalized additive models

A linear model


lm(
  response_var ~ explanatory_var1 + explanatory_var2, 
  data = dataset
)

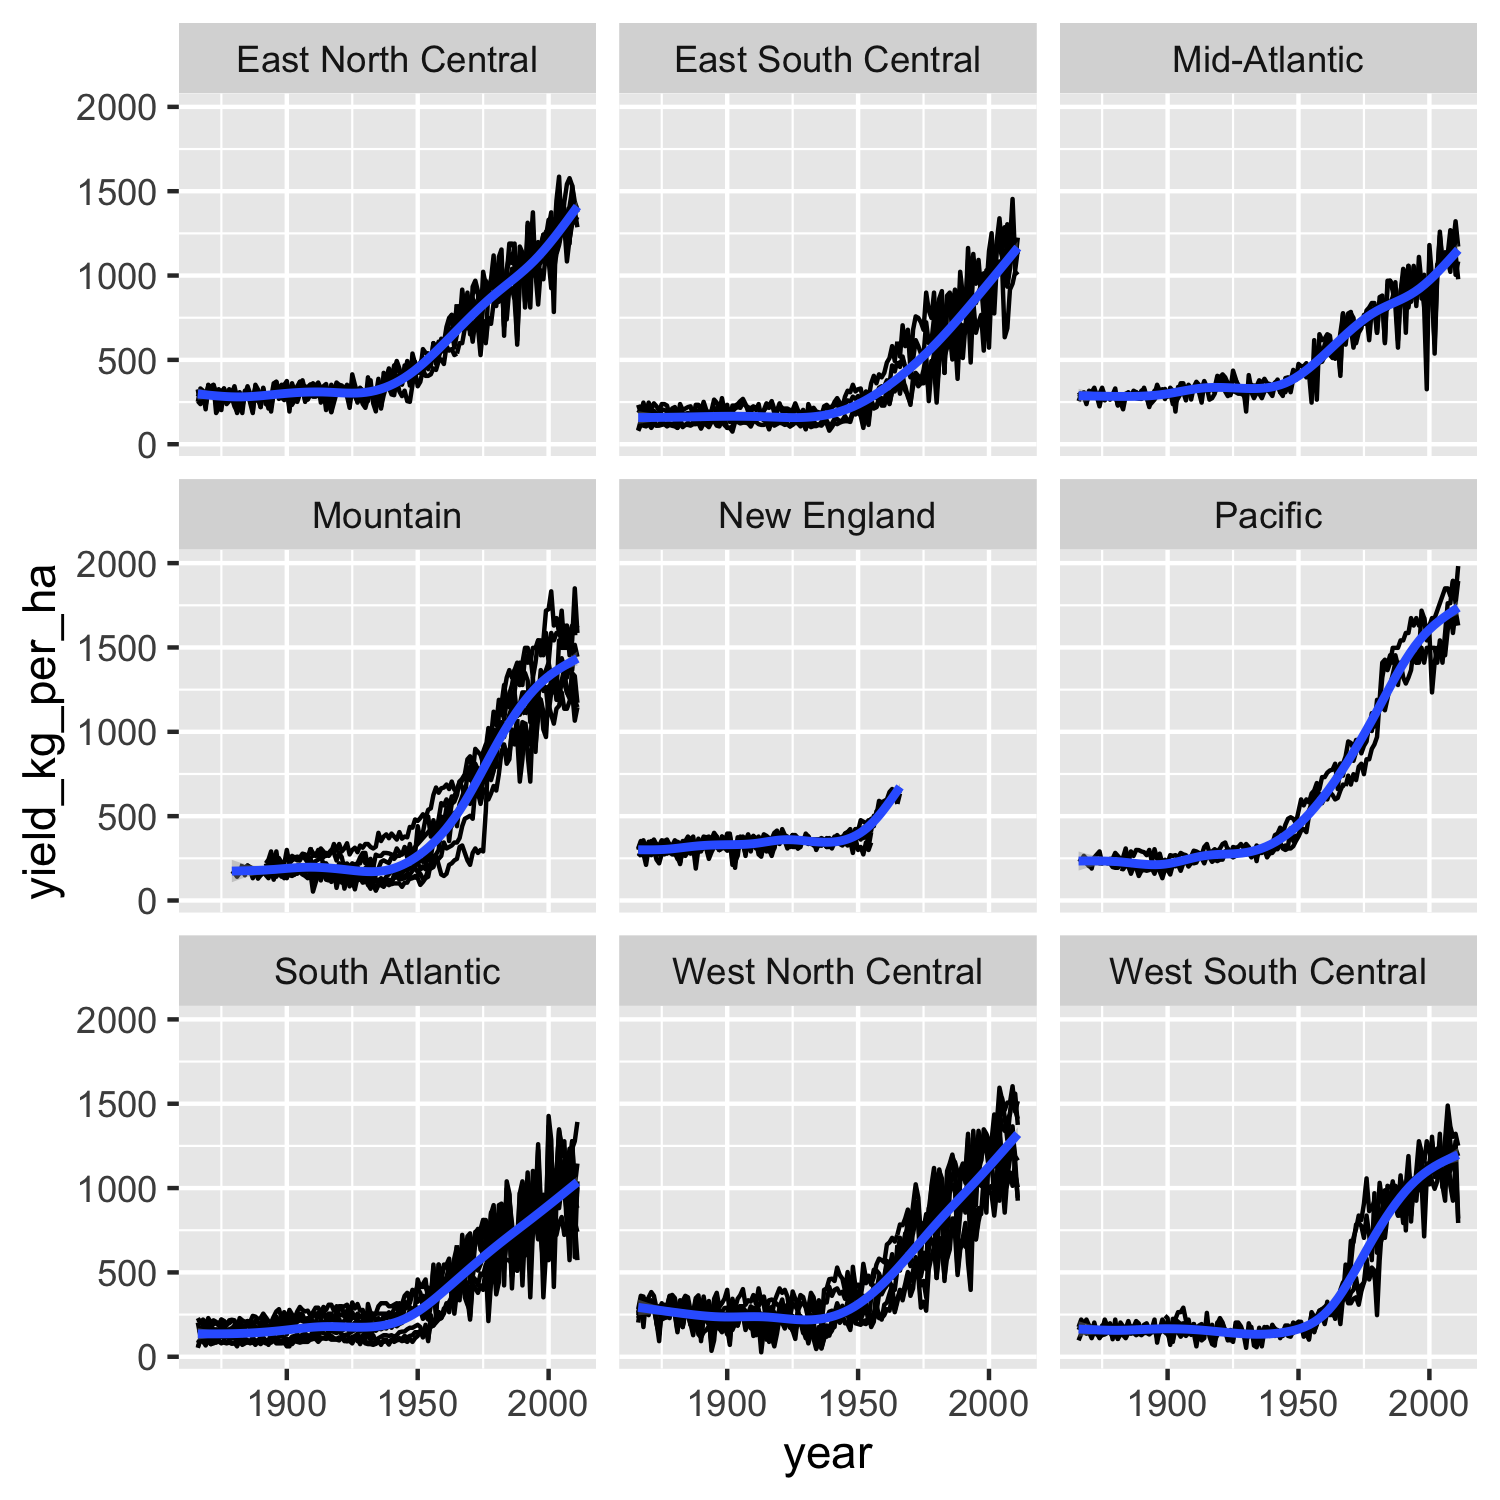
A generalized additive model

library(mgcv)
gam(
  response_var ~ s(explanatory_var1) + explanatory_var2, 
  data = dataset
)
Introduzione alla scrittura di funzioni in R

Predicting GAMs

predict_this <- data.frame(
  explanatory_var1 = c("some", "values"),
  explanatory_var2 = c("more", "values")
)
predicted_responses <- predict(model, predict_this, type = "response")
predict_this %>%
  mutate(predicted_responses = predicted_responses)
Introduzione alla scrittura di funzioni in R

Let's practice!

Introduzione alla scrittura di funzioni in R

Preparing Video For Download...