Pulizia dei dati ed EDA

A/B Testing in Python

Moe Lotfy, PhD

Principal Data Science Manager

Pulizia dei valori mancanti

  • Valori mancanti
    • Elimina, ignora, imputa
# Calculate the mean order value
checkout.order_value.mean()
30.0096
# Replace missing values with zeros and get mean
checkout['order_value'].fillna(0).mean()
25.3581
A/B Testing in Python

Pulizia dei duplicati

  • Duplicati
    • Le righe identiche vanno eliminate
# Check for duplicate rows due to logging issues 
print(len(checkout))
print(len(checkout.drop_duplicates(keep='first')))
9000
9000
A/B Testing in Python

Pulizia dei duplicati

  • Duplicati
    • Gestire con attenzione gli utenti duplicati.
# Unique users in group B
print(checkout[checkout['checkout_page'] == 'B']['user_id'].nunique())
# Unique users who purchased at least once
print(checkout[checkout['checkout_page'] == 'B'].groupby('user_id')['purchased'].max().sum())
# Total purchase events in group B
print(checkout[checkout['checkout_page'] == 'B']['purchased'].sum())
2938
2491.0
2541.0
A/B Testing in Python

Statistiche di riepilogo EDA

  • Riepilogo di media, conteggio e deviazione standard
checkout.groupby('checkout_page')['order_value'].agg({'mean','std','count'})
                    mean     count    std
checkout_page            
        A        24.956437    2461    2.418837
        B        29.876202    2541    7.277644
        C        34.917589    2603    4.869816
A/B Testing in Python

Grafici EDA

  • Grafici a barre
sns.barplot(x=checkout['checkout_page'], y=checkout['order_value'], estimator=np.mean)
plt.title('Average Order Value per Checkout Page Variant')
plt.xlabel('Checkout Page Variant')
plt.ylabel('Order Value [$]')
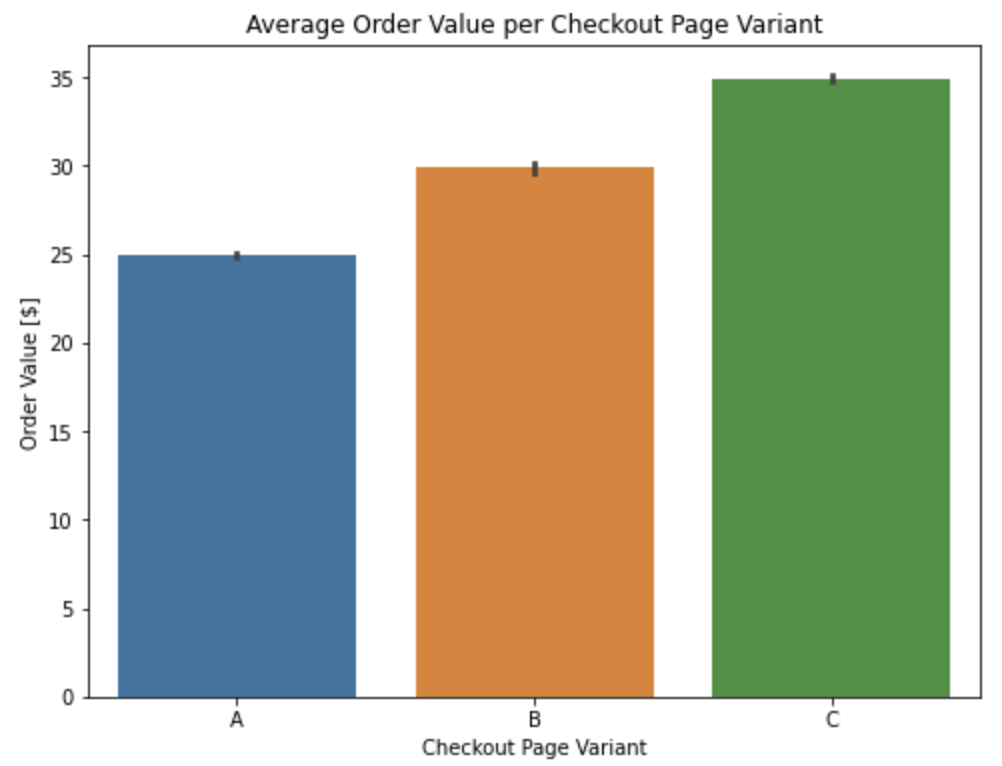
Grafico a barre del valore medio dell'ordine per variante della pagina di checkout

A/B Testing in Python

Grafici EDA

  • Istogrammi
sns.displot(data=checkout, x='order_value', hue = 'checkout_page', kde=True)
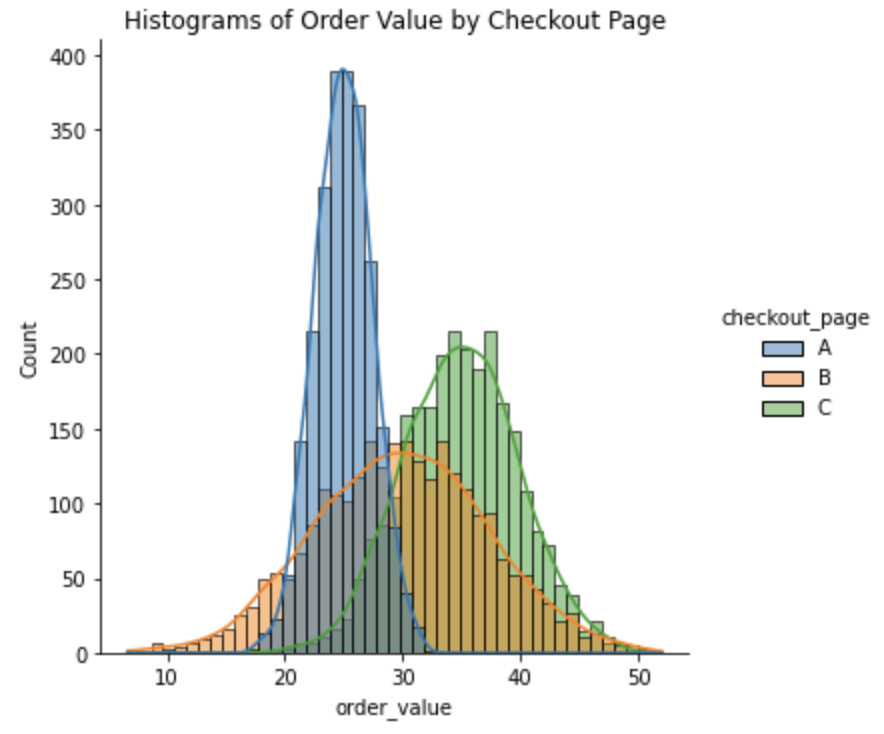
Istogramma del valore dell'ordine

A/B Testing in Python

Grafici EDA

  • Serie temporali (line plot)
sns.lineplot(data=AdSmart,x='date', y='yes', hue='experiment', errorbar=None)
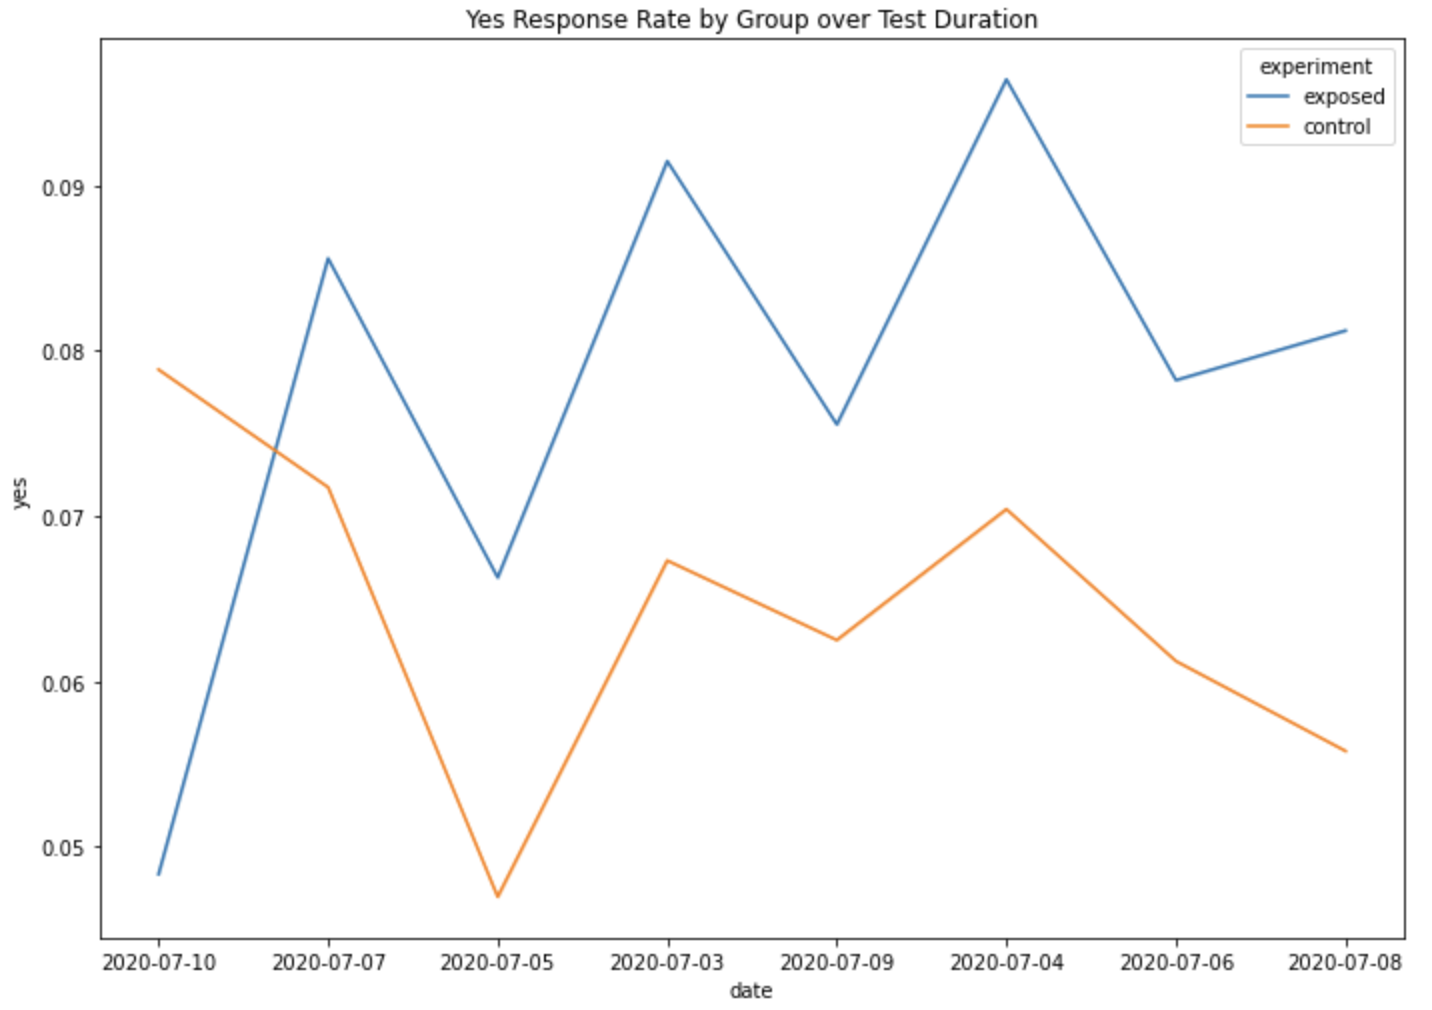
Serie temporale della quota di utenti che risponde yes a un annuncio

1 Adsmart Kaggle dataset: https://www.kaggle.com/datasets/osuolaleemmanuel/ad-ab-testing
A/B Testing in Python

Esercitiamoci!

A/B Testing in Python

Preparing Video For Download...