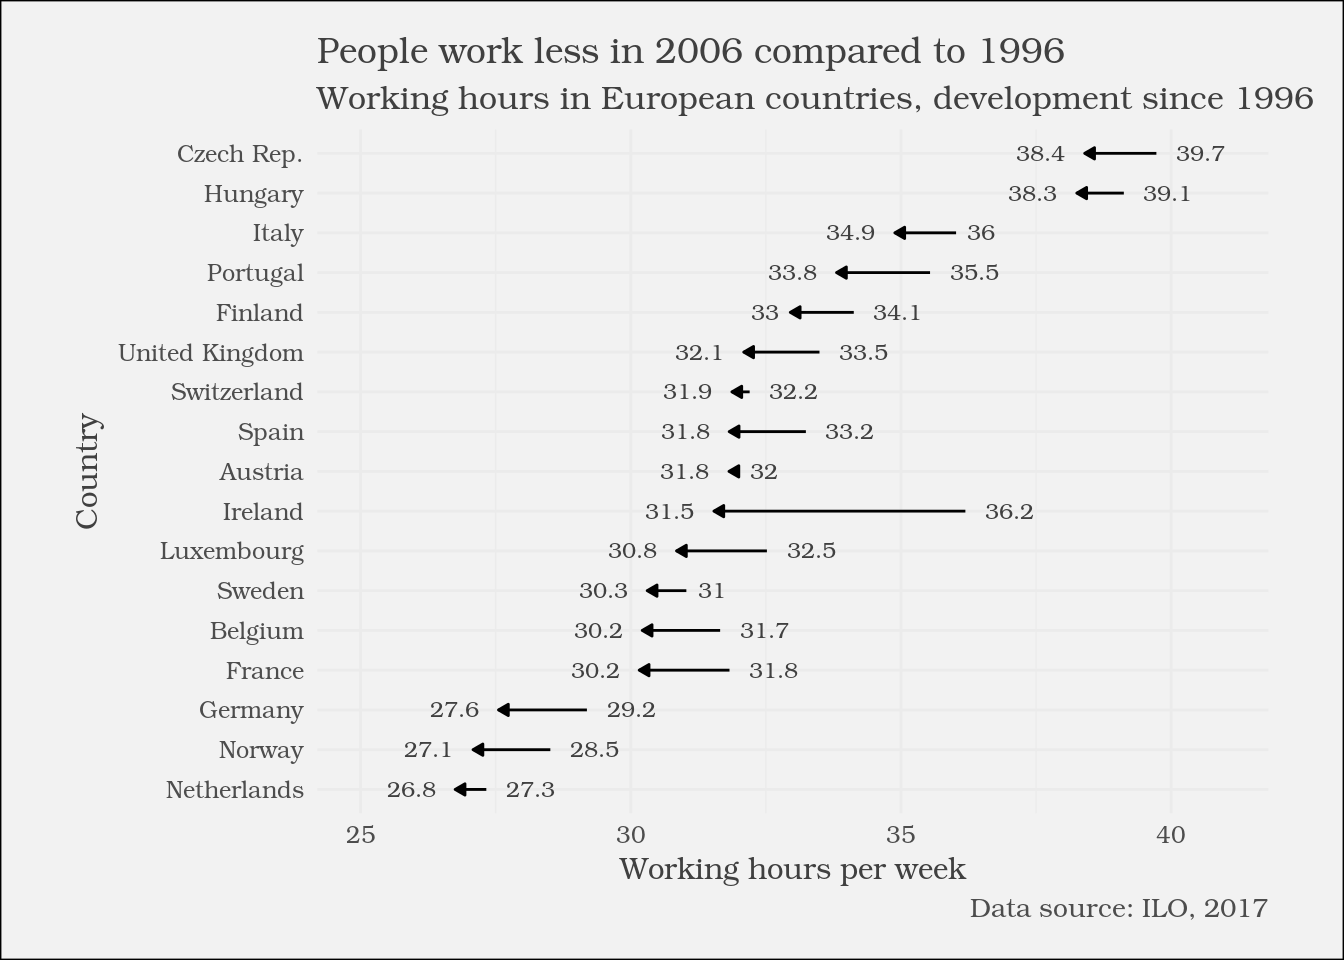
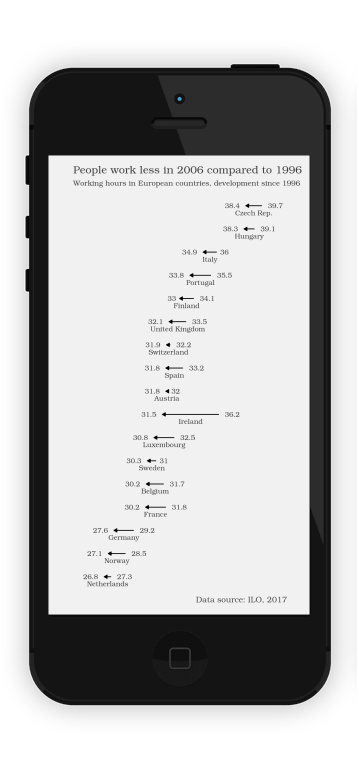
Finalizing the plot for different audiences and devices
Comunicare con i dati nel Tidyverse

Timo Grossenbacher
Data Journalist
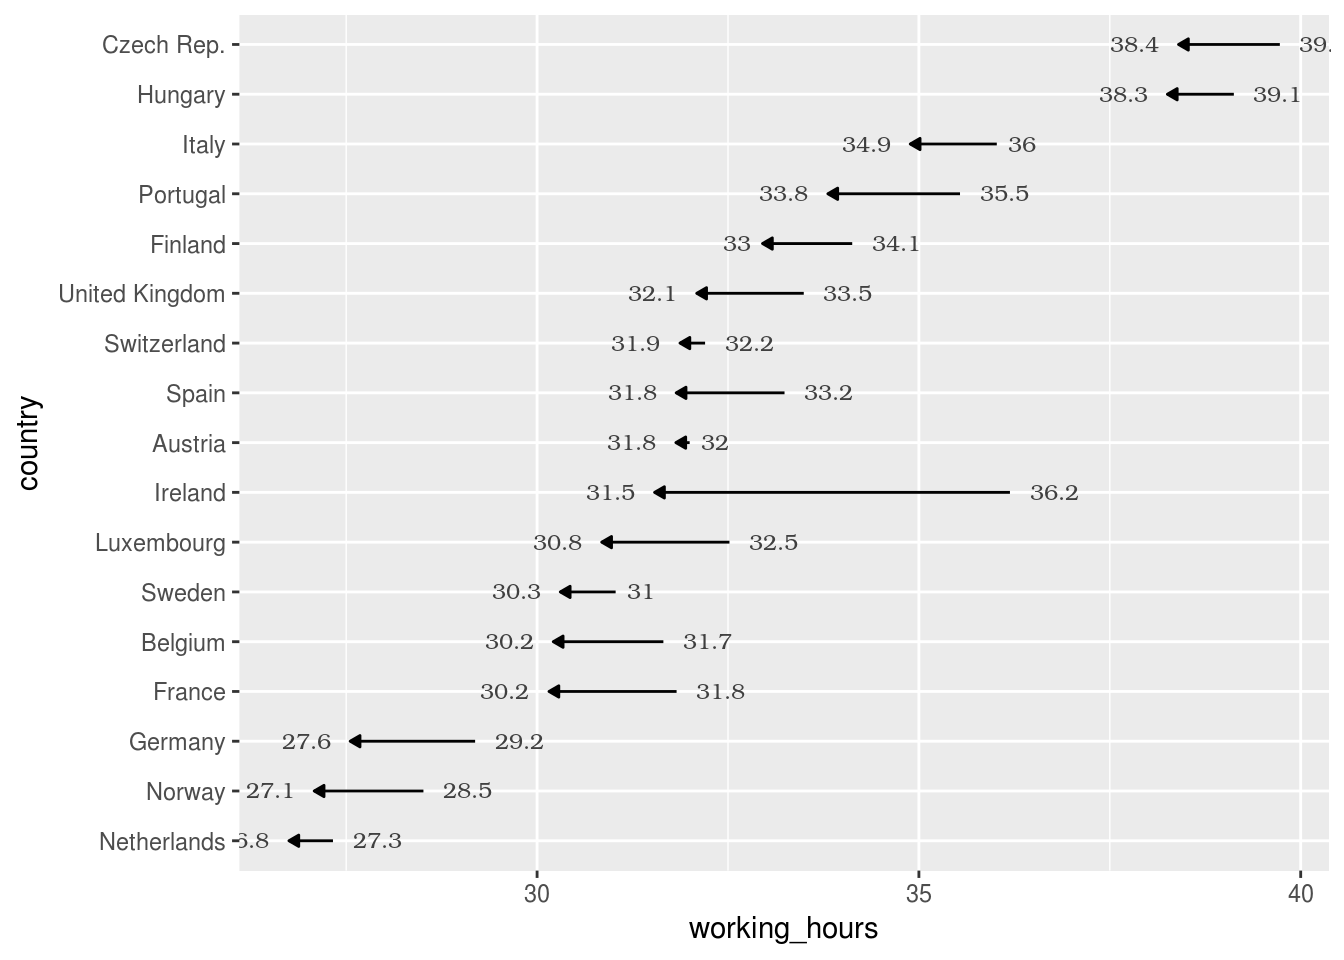
coord_cartesian vs. xlim / ylim
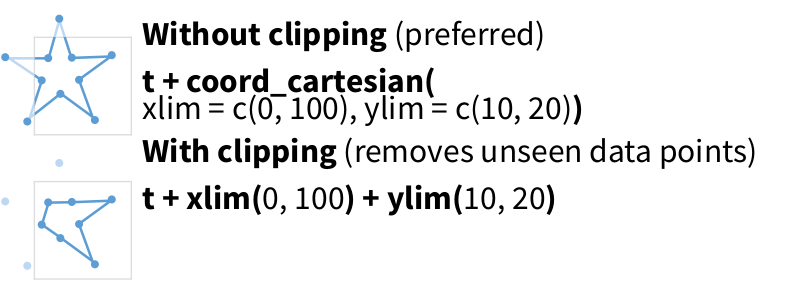
1 Taken from RStudio Data Visualization Cheat Sheet (https://github.com/rstudio/cheatsheets/blob/main/data-visualization-2.1.pdf)