Comunicare con i dati nel Tidyverse
Timo Grossenbacher
Data Journalist


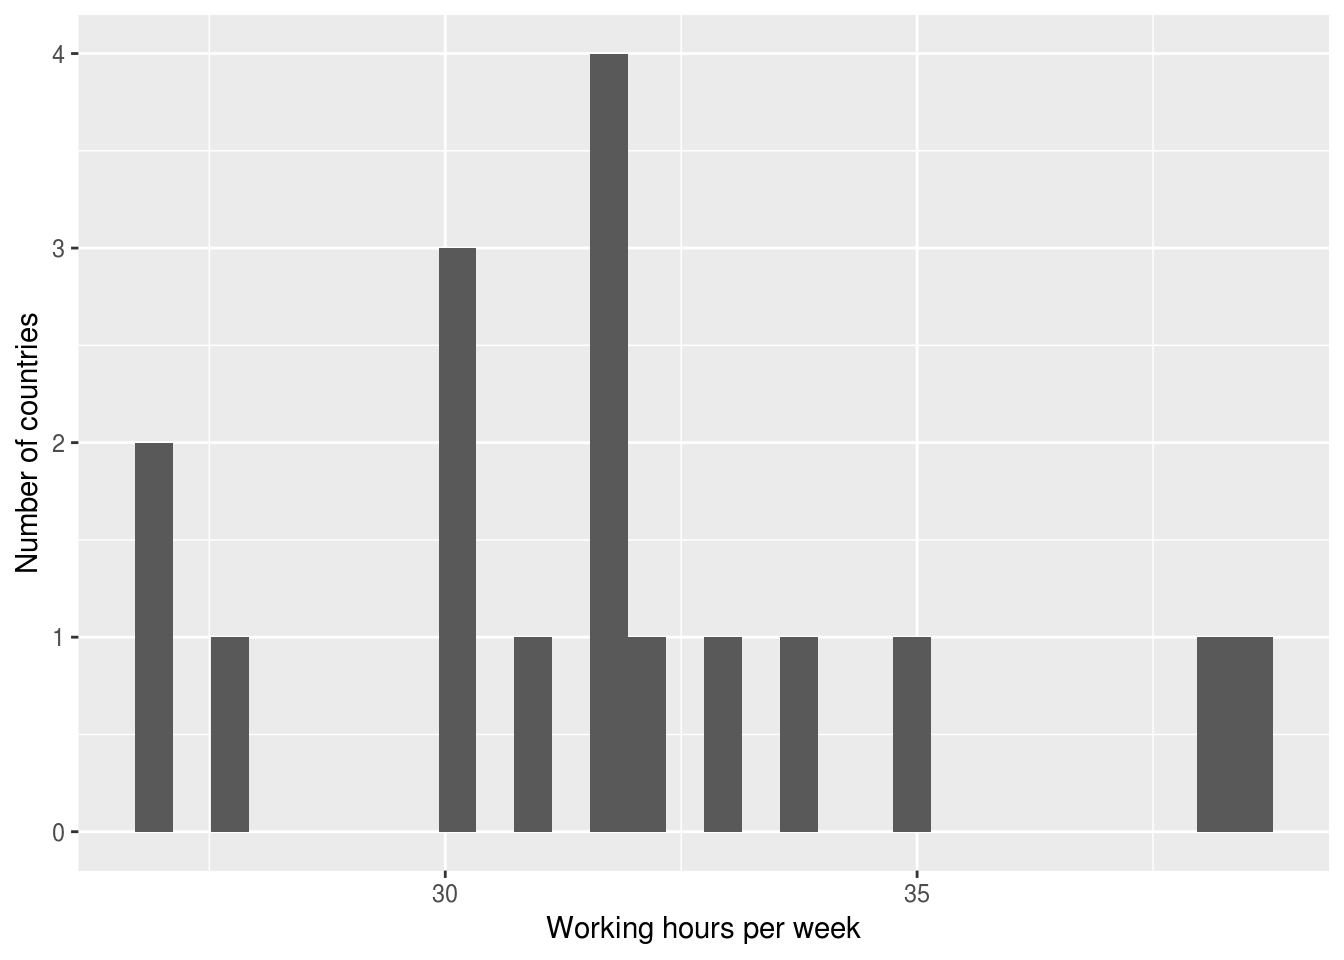
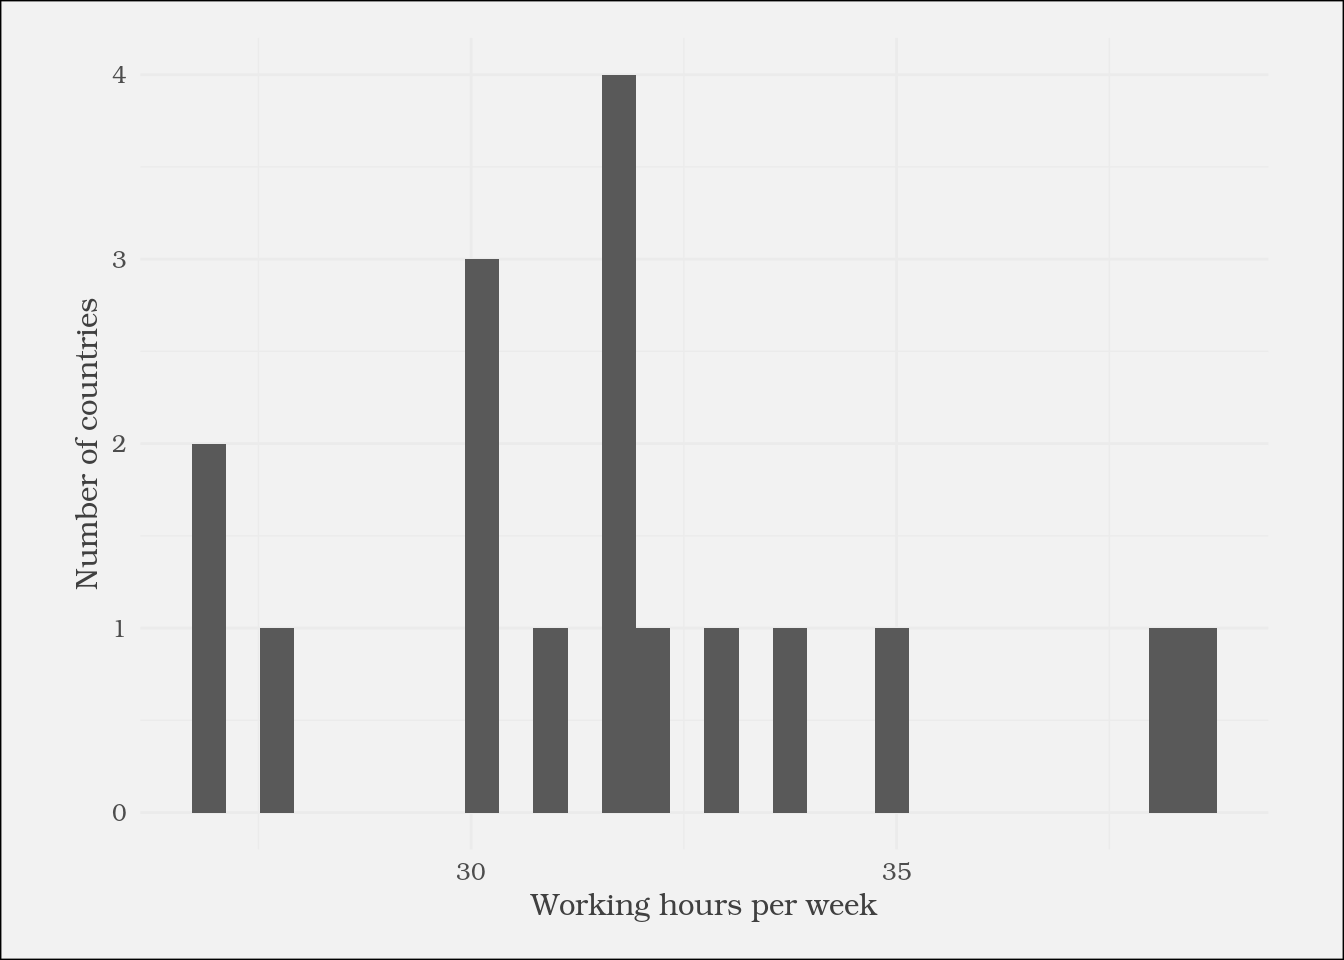
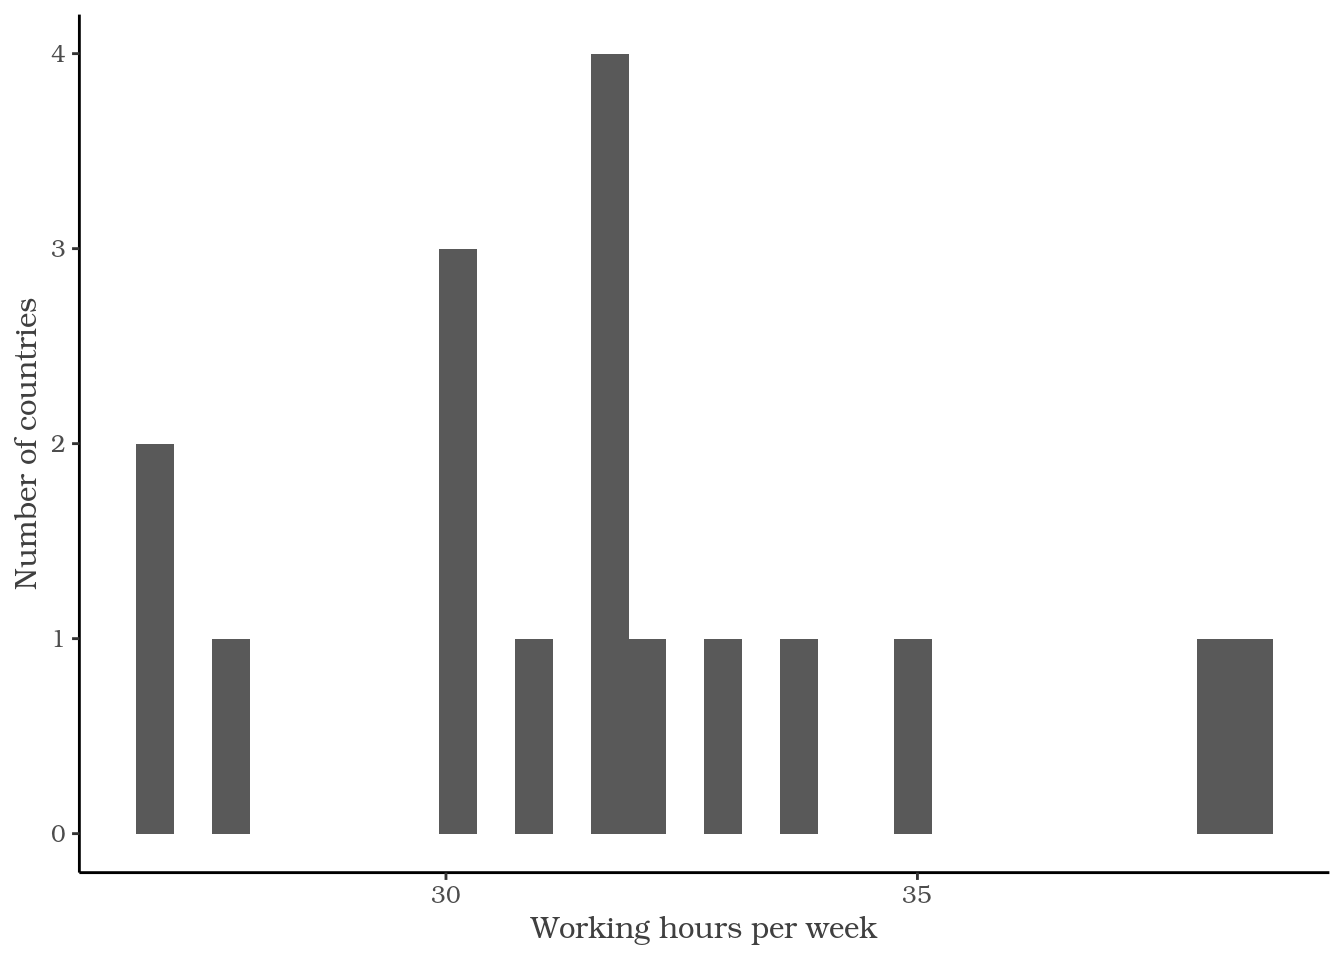
ggplot(plot_data) +
geom_histogram(aes(
x = working_hours)) +
labs(x = "Working hours per week",
y = "Number of countries") +
theme(
text = element_text(
family = "Bookman",
color = "gray25")
)

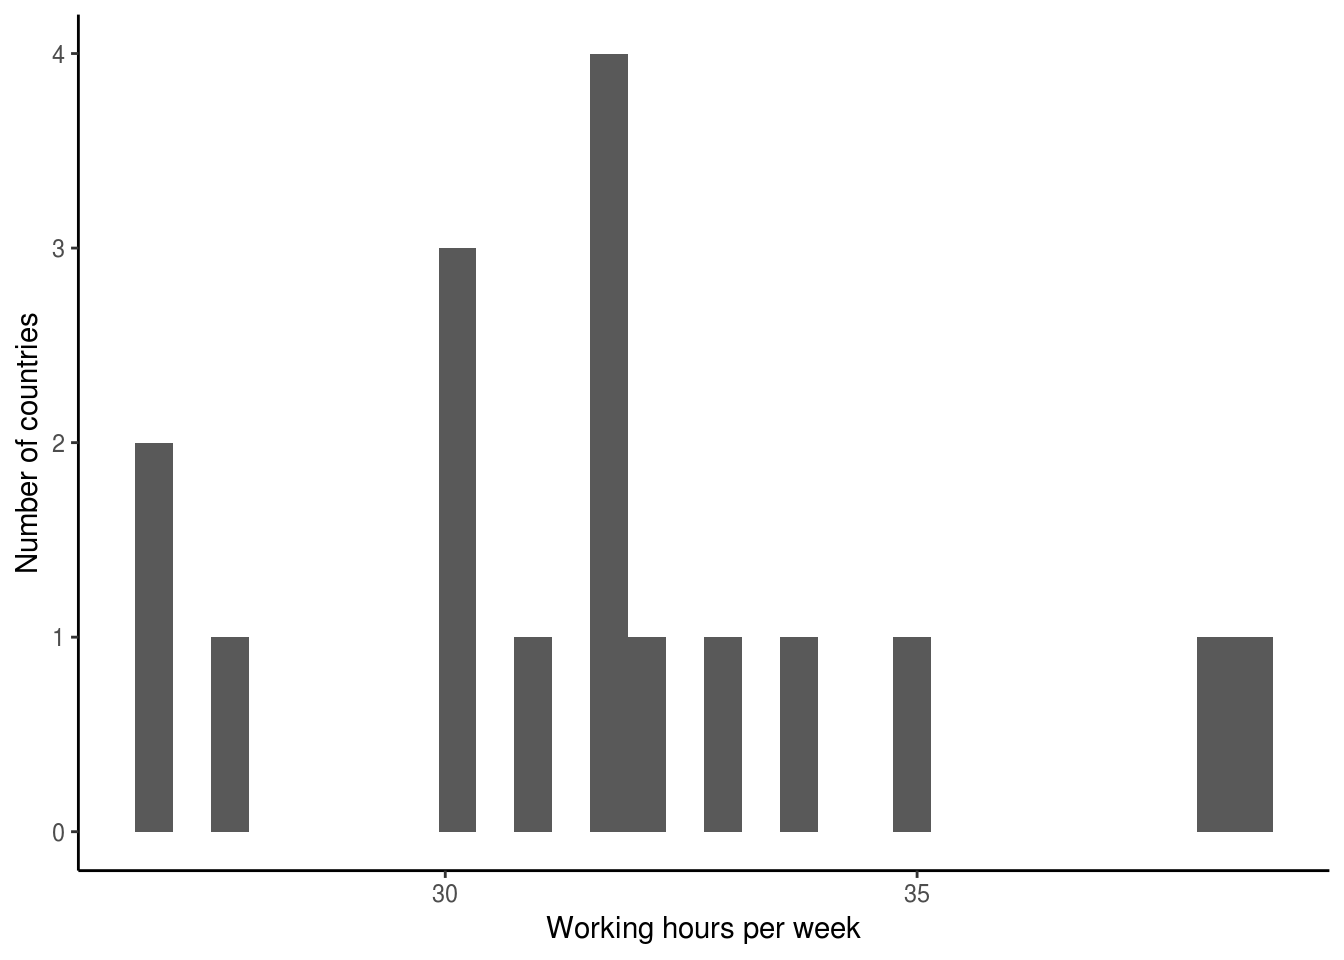
ggplot(plot_data) +
geom_histogram(aes(
x = working_hours)) +
labs(x = "Working hours per week",
y = "Number of countries") +
theme_classic()

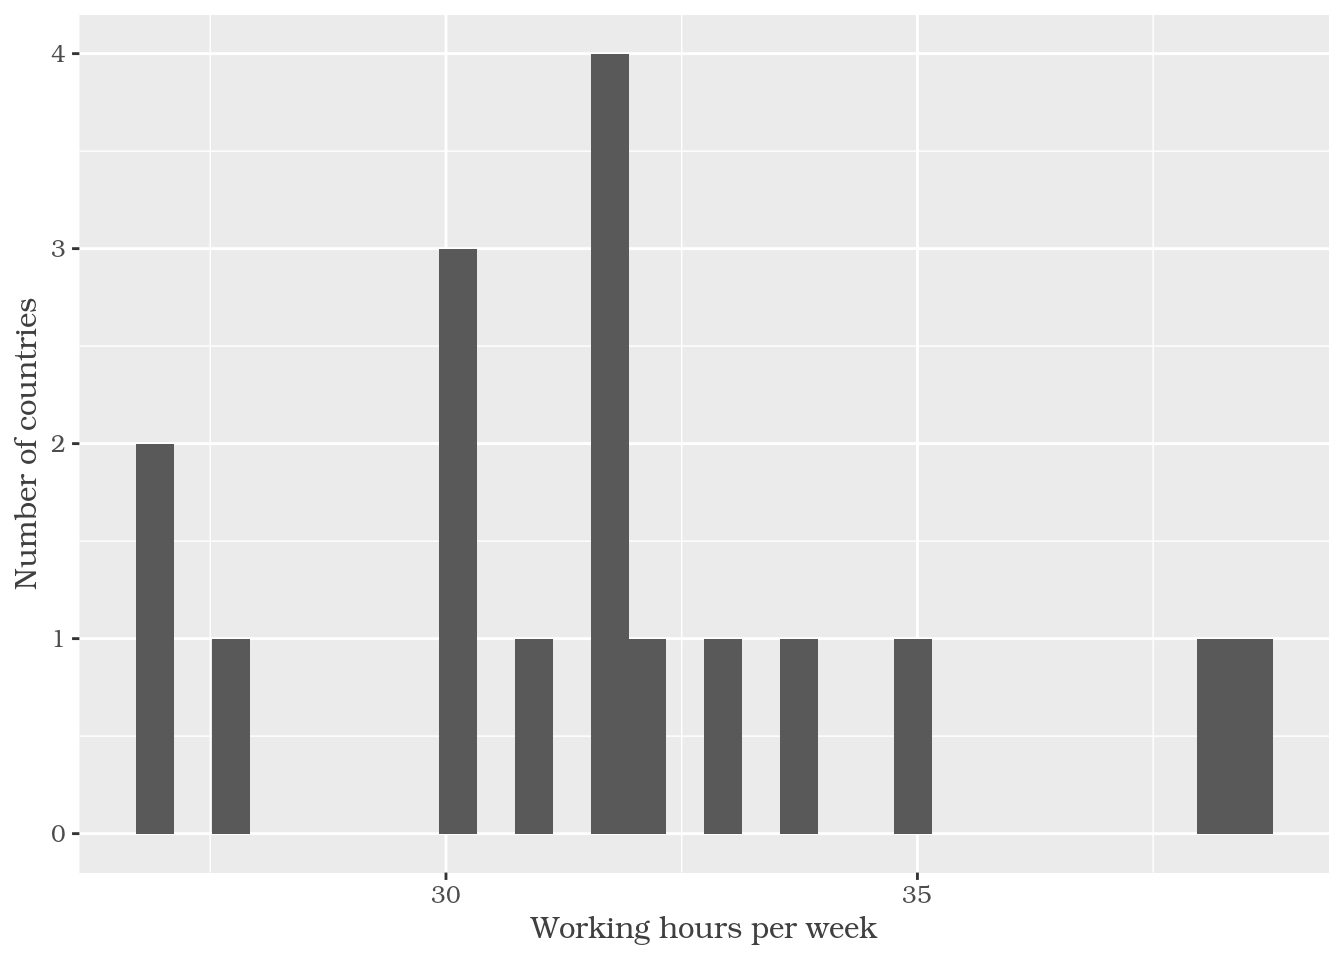
ggplot(plot_data) +
geom_histogram(aes(
x = working_hours)) +
labs(x = "Working hours per week",
y = "Number of countries") +
theme_classic() +
theme(
text = element_text(
family = "Bookman",
color = "gray25")
)

?theme
axis.title
etichetta degli assi (element_text; eredita da text)
axis.title.x
etichetta asse x (element_text; eredita da axis.title)
axis.title.x.top
etichetta asse x sull'asse superiore (element_text; eredita da axis.title.x)
axis.title.x.bottom
etichetta asse x sull'asse inferiore (element_text; eredita da axis.title.x)
element_text()
element_rect()
element_line()
element_blank()
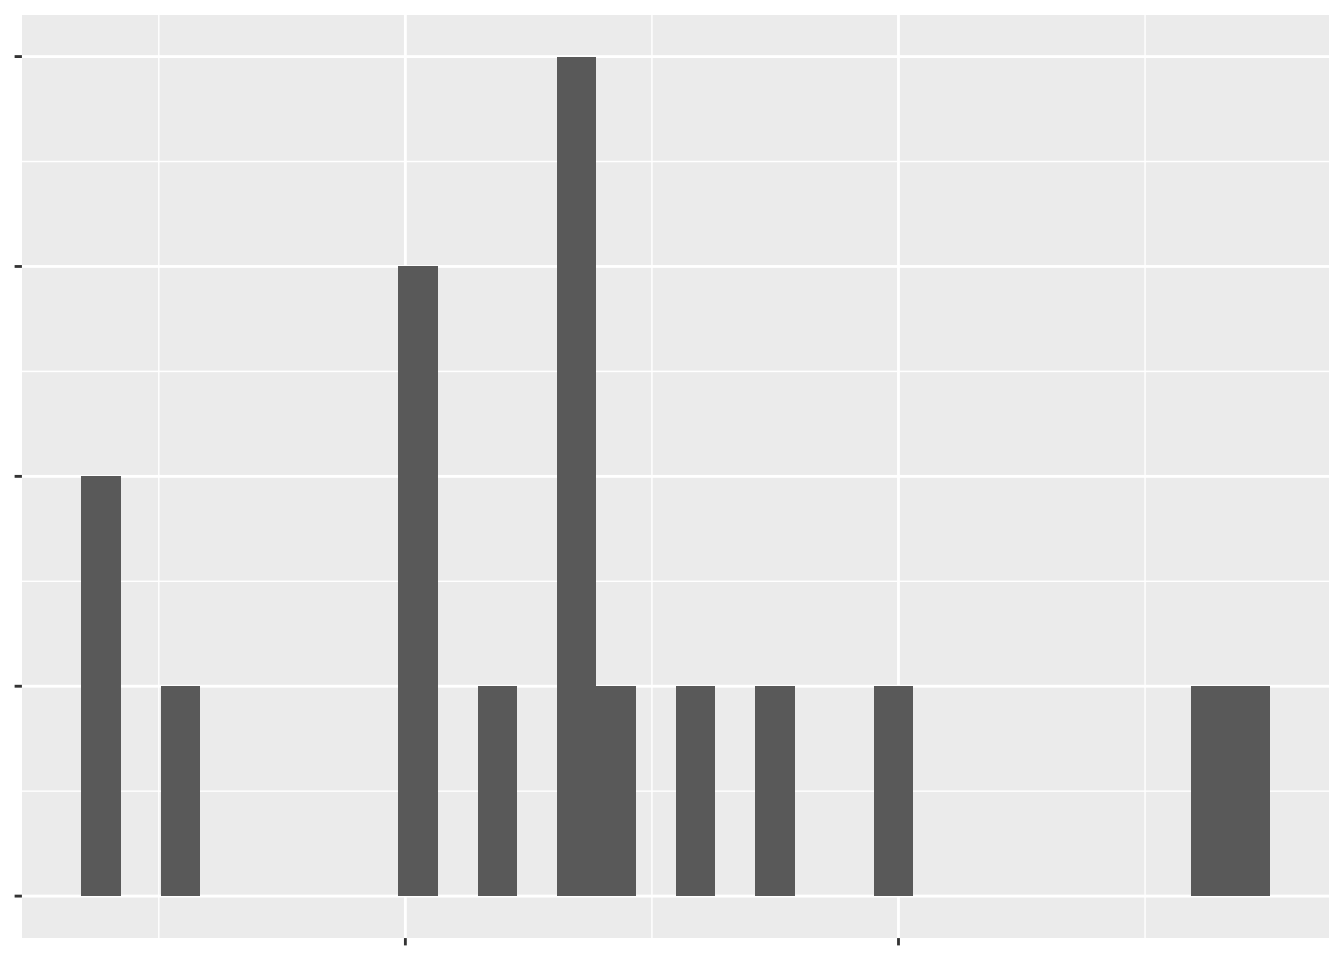
ggplot(plot_data) +
geom_histogram(aes(
x = working_hours)) +
labs(x = "Working hours per week",
y = "Number of countries") +
theme(
text = element_blank()
)

Comunicare con i dati nel Tidyverse