Creare dashboard con Dash e Plotly
Alex Scriven
Data Scientist
$$
La maggior parte dei siti ha file CSS;
style al suo posto
Il CSS può essere usato anche su un elemento HTML
style di un tag"property:value; property:value;"

<h1>Welcome to the website!</h1>
<h2 style="font-size:50px;color:red">
Enjoy your stay!
</h2>

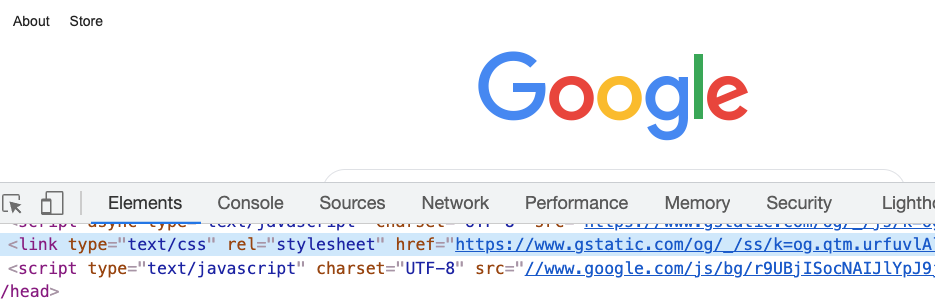
Possiamo modificare del CSS su un sito live

Argomento style dei componenti Dash
Codice precedente in un componente Dash:
app.layout = [
html.H1('Welcome to the website!'),
html.H2('Text',
style={'font-size':'50px',
'color':'red'})
]
Con il CSS puoi impostare:
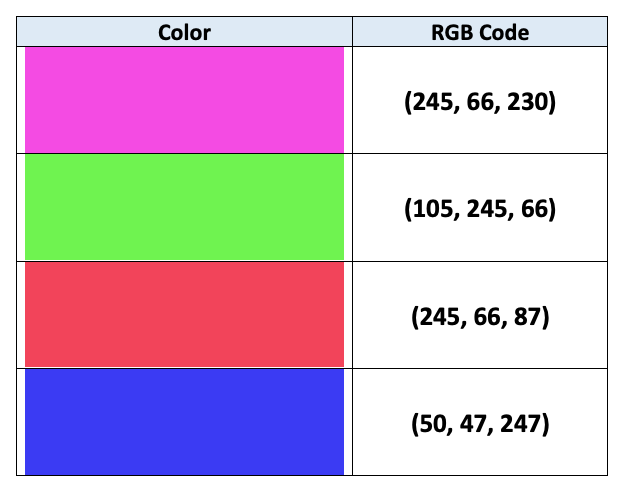
background-color)color)
Entrambi accettano stringhe (es. 'red') o codici RGB (es. 'rgb(0,0,255)' è blu!)

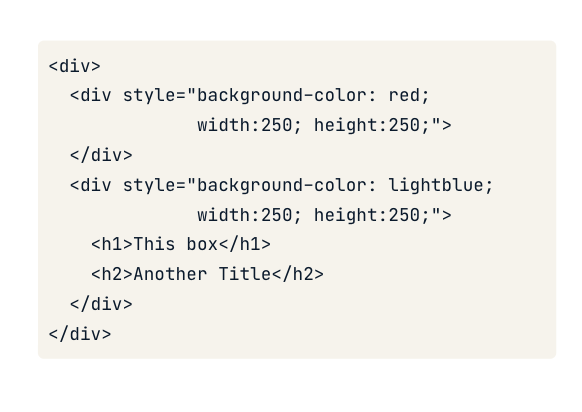
Il CSS può impostare le dimensioni con le proprietà width e height
app.layout = [
# Add & resize the company logo
html.Img(src=logo_link,
style={'width':'250px', 'height':'250px'})
]
app.layout = [
# Add & resize the company logo
html.Img(src=logo_link,
style={'width':'50%', 'height':'50%'})
]
Creare dashboard con Dash e Plotly