HTML in Dash

Creare dashboard con Dash e Plotly

Alex Scriven

Data Scientist

Ripasso di HTML


  • HTML = linguaggio per strutturare contenuti web
    • Usa "tag" come Div, H1>H6
  • Dash usa i componenti dash.html
    • Il tag H1 è .H1()
    • Il tag Div è .Div()
<div>
  <div style=
       "background-color: red; 
        width:250; height:250;">
  </div>
  <div style=
       "background-color: lightblue; 
        width:250; height:250;">
    <h1>This box</h1>
  </div>
</div>
Creare dashboard con Dash e Plotly

Tag di struttura


  • Elenco dei tag HTML disponibili - documentazione
  • Tag di struttura importanti:
    • .Br() = A capo
    • .Img() = Inserisci un'immagine
Creare dashboard con Dash e Plotly

Liste in HTML Dash


  • .Ul() \ .Ol() & .Li() = Crea liste
    • .Ul() per elenco non ordinato (punti elenco, come questi!)
    • .Ol() per elenco ordinato (numerato)
    • .Li() per ogni elemento della lista
Creare dashboard con Dash e Plotly

Inserire un logo aziendale


app.layout = [

html.Img(src='www.website.com/logo.png'), html.H1("Our Sales Dashboard")
]


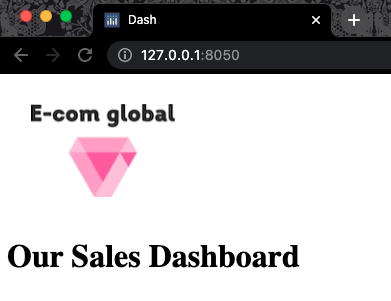
Una schermata dell'angolo in alto a sinistra di un browser Chrome con l'indirizzo del server nella barra URL. Il browser mostra il logo aziendale, un diamante rosa con la scritta E-com global. Sotto c'è un titolo: 'Our Sales Dashboard'

Creare dashboard con Dash e Plotly

Tag di testo


Imposta e formatta il testo

  • .P() o .Span() = Inserisci testo semplice
    • Accettano l'argomento children (lista di testo, .P() o .Span())
  • .B() = Grassetto per parte del testo
  • .I() = Corsivo per parte del testo
Creare dashboard con Dash e Plotly

Tag di testo HTML in Dash


Formattazione più complessa:

app.layout = [
   html.H1("Our Sales Dashboard"),

html.Span(children=[
f"Prepared: {datetime.now().date()}",
" by ", html.B("Jessie Parker, "),
html.I("Data Scientist")
])
]


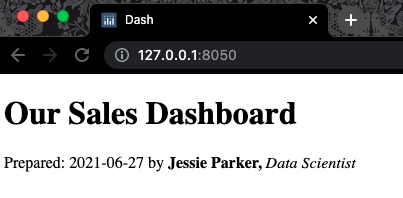
Una schermata dell'angolo in alto a sinistra di una finestra Chrome con l'indirizzo del server visibile nella barra URL. C'è un grande titolo 'our sales dashboard'; sotto una riga: "Prepared: 2021-06-27 by Jessie Parker, data scientist". Jessie Parker è in grassetto e data scientist in corsivo

Creare dashboard con Dash e Plotly

Spezzare il testo

$$

app.layout = [
   html.H1("Our Sales Dashboard"),
   html.Span(children=[
   f"Prepared: {datetime.now().date()}", 
   html.Br(),
   " by ", html.B("Jessie Parker, "),
   html.Br(),
   html.I("Data Scientist")])
    ]

 

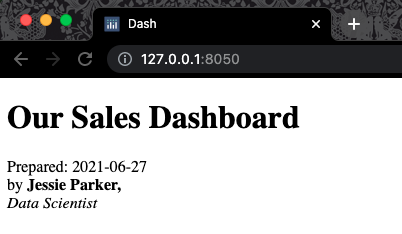
Una schermata dello stesso dashboard della diapositiva precedente. Angolo in alto a sinistra di una finestra Chrome con l'indirizzo del server nella barra URL. Grande titolo 'our sales dashboard'; sotto la riga "Prepared: 2021-06-27 by Jessie Parker, data scientist". Jessie Parker è in grassetto e data scientist in corsivo. Ora ci sono interruzioni di riga dopo la data e il nome.

Creare dashboard con Dash e Plotly

Esercitiamoci!

Creare dashboard con Dash e Plotly

Preparing Video For Download...