Creare report efficaci in Power BI
Acquisizione dei dati e modelli semantici con Microsoft Fabric

Alex Kuntz
Head of Cloud Curriculum, DataCamp
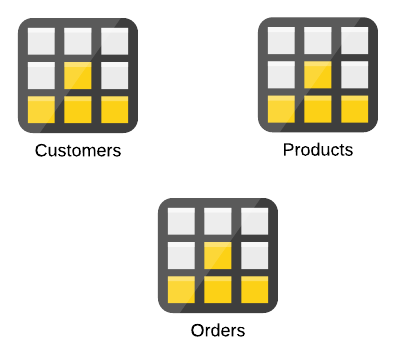
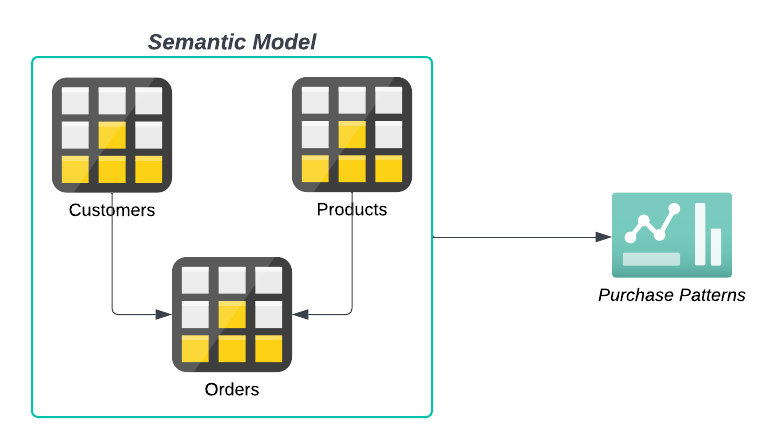
Capire i modelli semantici
- Rappresentazione logica dei dati: Semplifica dati complessi per un’analisi intuitiva

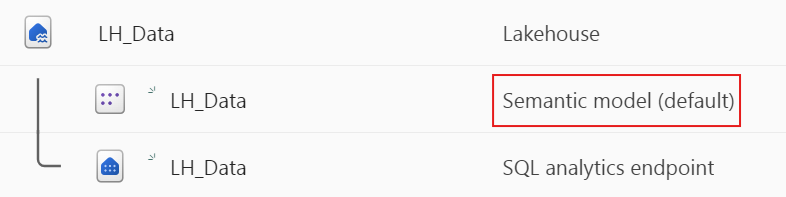
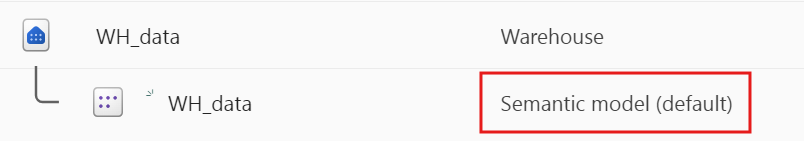
Creazione automatica: Generato automaticamente durante la creazione di Lakehouse/Warehouse.
Lakehouse:
Warehouse:
Capire le relazioni nel modello
- Creare relazioni: Collega colonne corrispondenti per unificare dati da più tabelle.
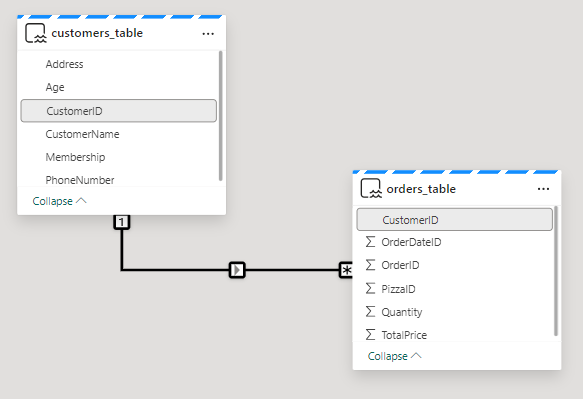
Cardinalità nelle relazioni
Cardinalità: Definisce come i dati di una tabella si collegano a un’altra.
- Uno-a-molti (1:*) Un record si collega a molti nell’altra tabella.
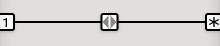
- Uno-a-uno (1:1) Ogni record ha una corrispondenza unica in entrambe le tabelle.
- Molti-a-molti (:) Più record in entrambe le tabelle si collegano tra loro.
- Uno-a-molti (1:*) Un record si collega a molti nell’altra tabella.
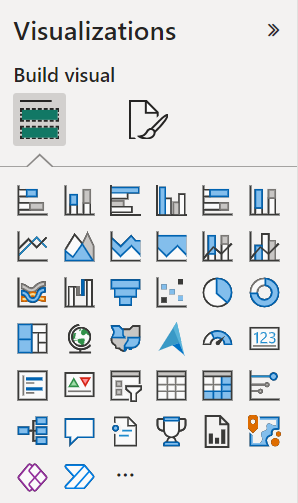
Visual in un report di Power BI
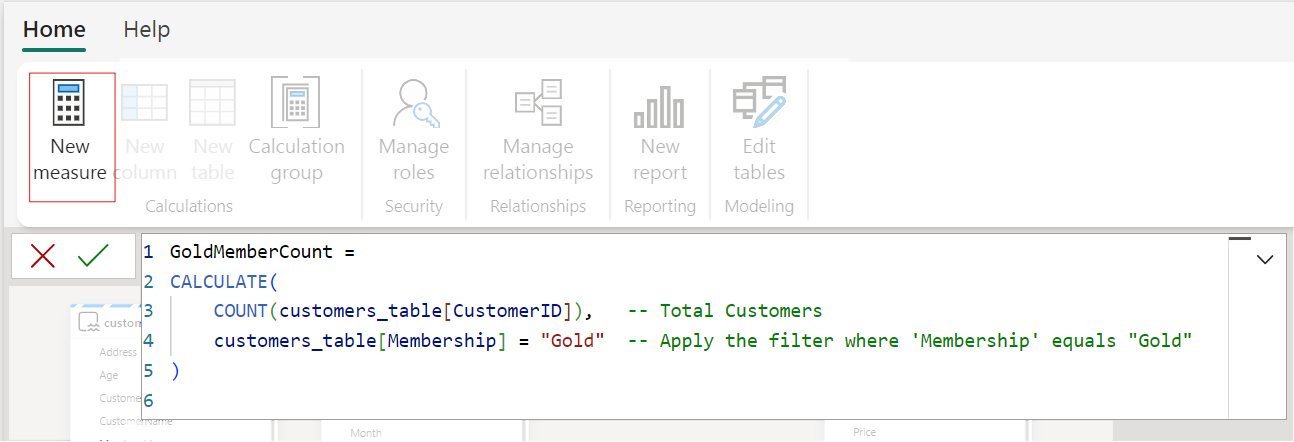
Introduzione a DAX
- Linguaggio DAX: Linguaggio di formule per Power BI
- Calcoli personalizzati: Crea somme, medie e altro
- Calcoli complessi: Funziona su più tabelle
- Usato per: Misure e Colonne calcolate
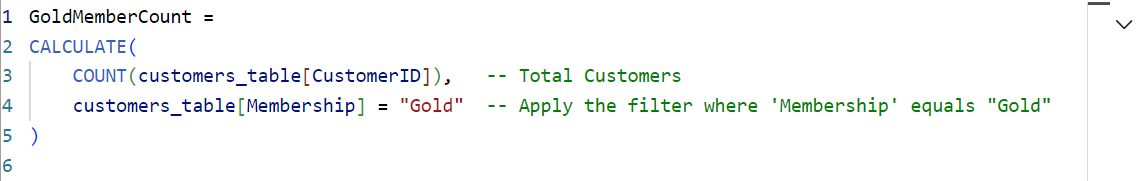
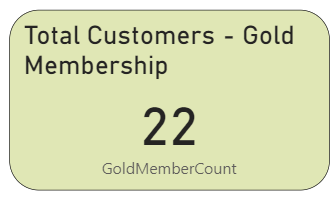
Misure
- Contesto di filtro: Calcolato in base a filtri e slicer del report
- Non archivia dati: Calcolato solo quando serve nei visual
- Nessuna colonna visibile: I risultati compaiono nei visual, non nelle tabelle dati
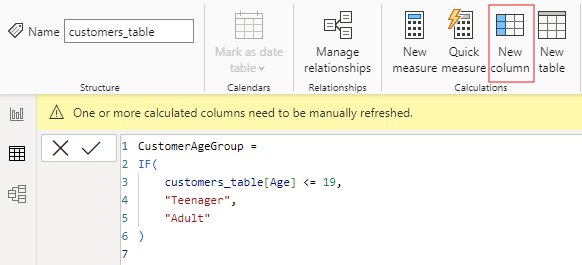
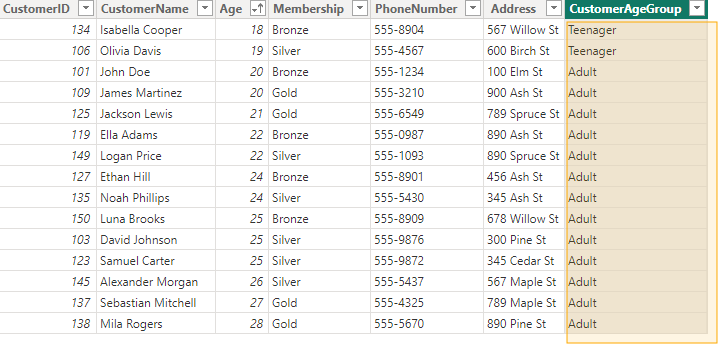
Colonne calcolate
- Contesto di riga: Calcolato per ogni riga del modello
- Aggiunge nuovi campi: Crea colonne permanenti nella tabella
- Valori statici: Calcolati una volta e visibili direttamente in tabella