Comparing spatially-related distributions
Buone pratiche di visualizzazione in R

Nick Strayer
Instructor
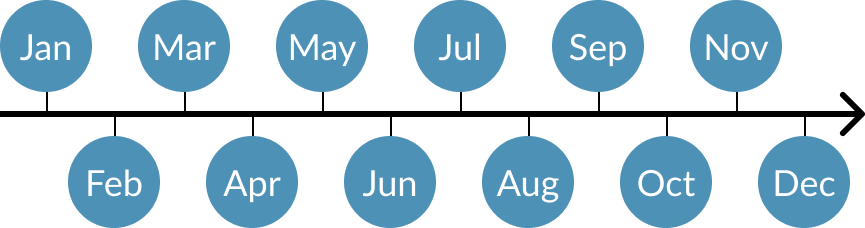
What are 'spatially connected axes'?
- There is an underlying ordering of the classes.
- E.g. months of the year: Jan < Feb < Mar < ...
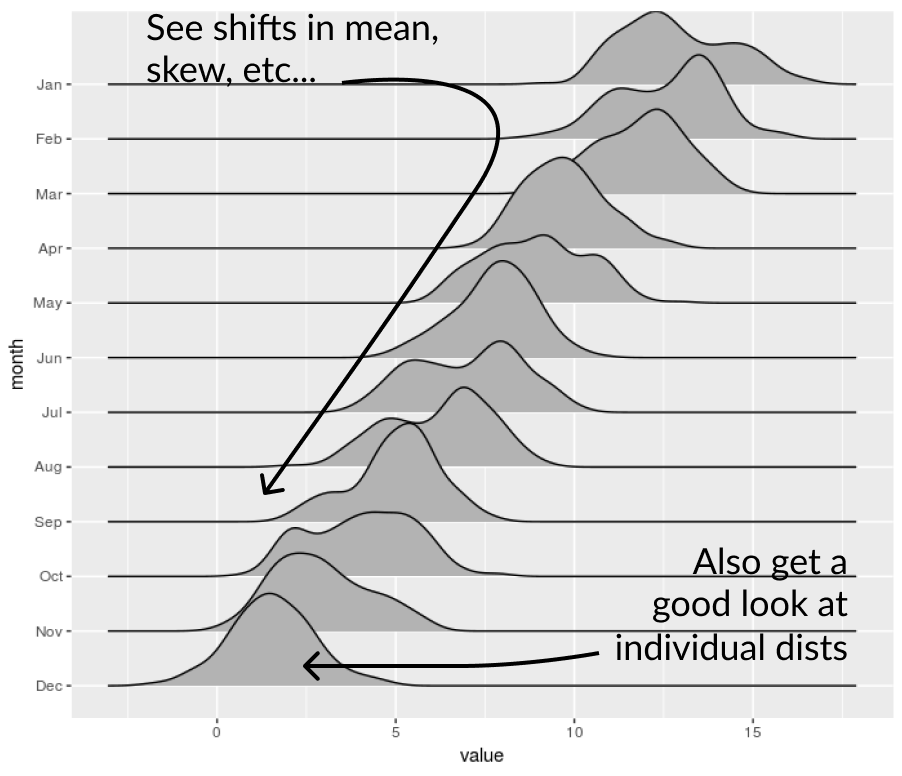
The ridgeline plot
library(ggridges) # Gives us geom_density_ridges()
ggplot(md_speeding, aes(x = speed_over, y = month)) +
  geom_density_ridges(bandwidth = 2) +
  xlim(1, 35)
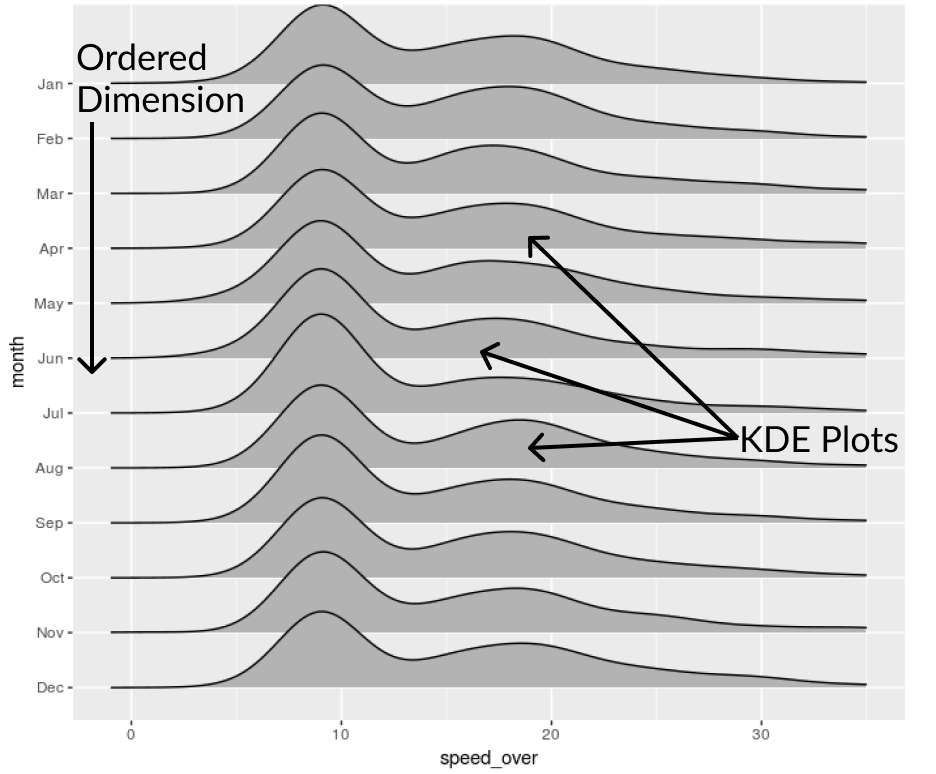
Ridgeline pros
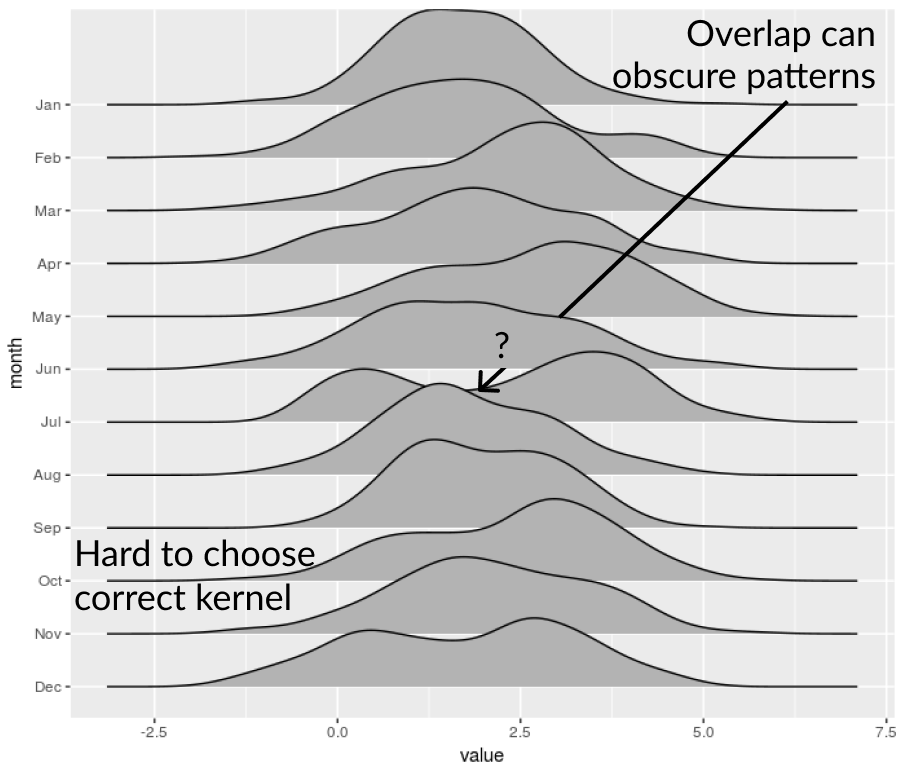
Ridgeline cons