Model Estimation and Likelihood
Introduzione alla modellazione lineare in Python

Jason Vestuto
Data Scientist
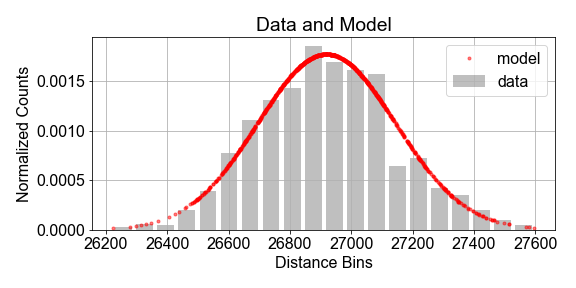
Estimation
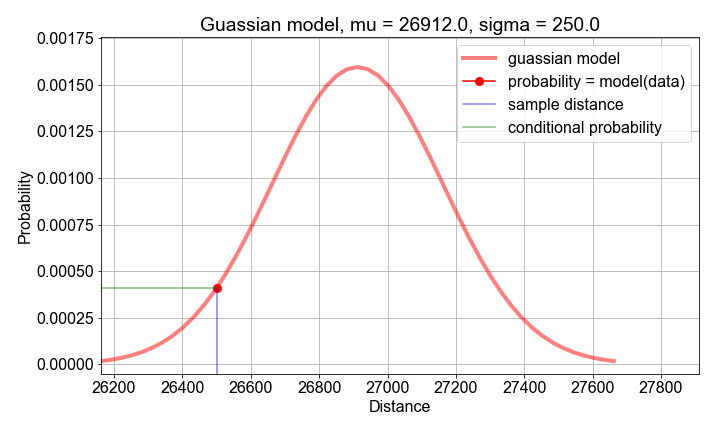
Computing Likelihood
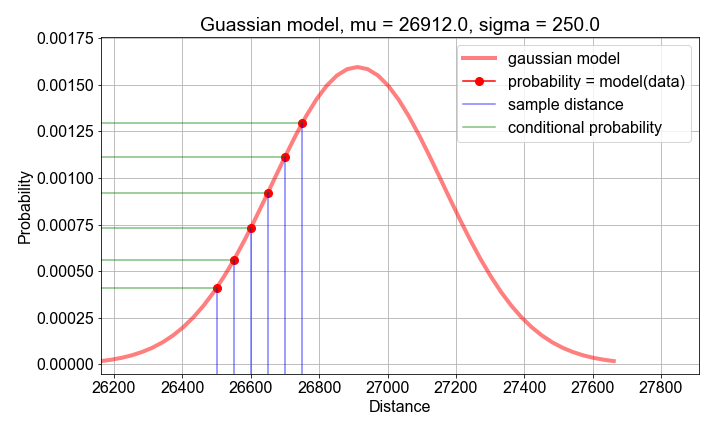
Computing Likelihood
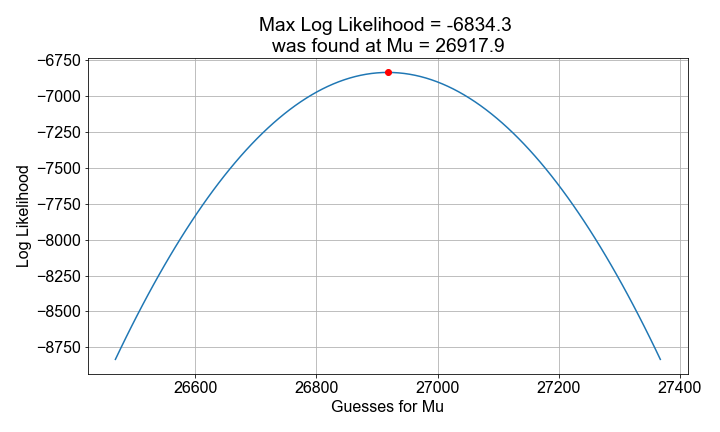
Maximum Likelihood Estimation
Introduzione alla modellazione lineare in Python
Jason Vestuto
Data Scientist

