Lavorare con i dati geospaziali in Python
Joris Van den Bossche
Open source software developer and teacher, GeoPandas maintainer

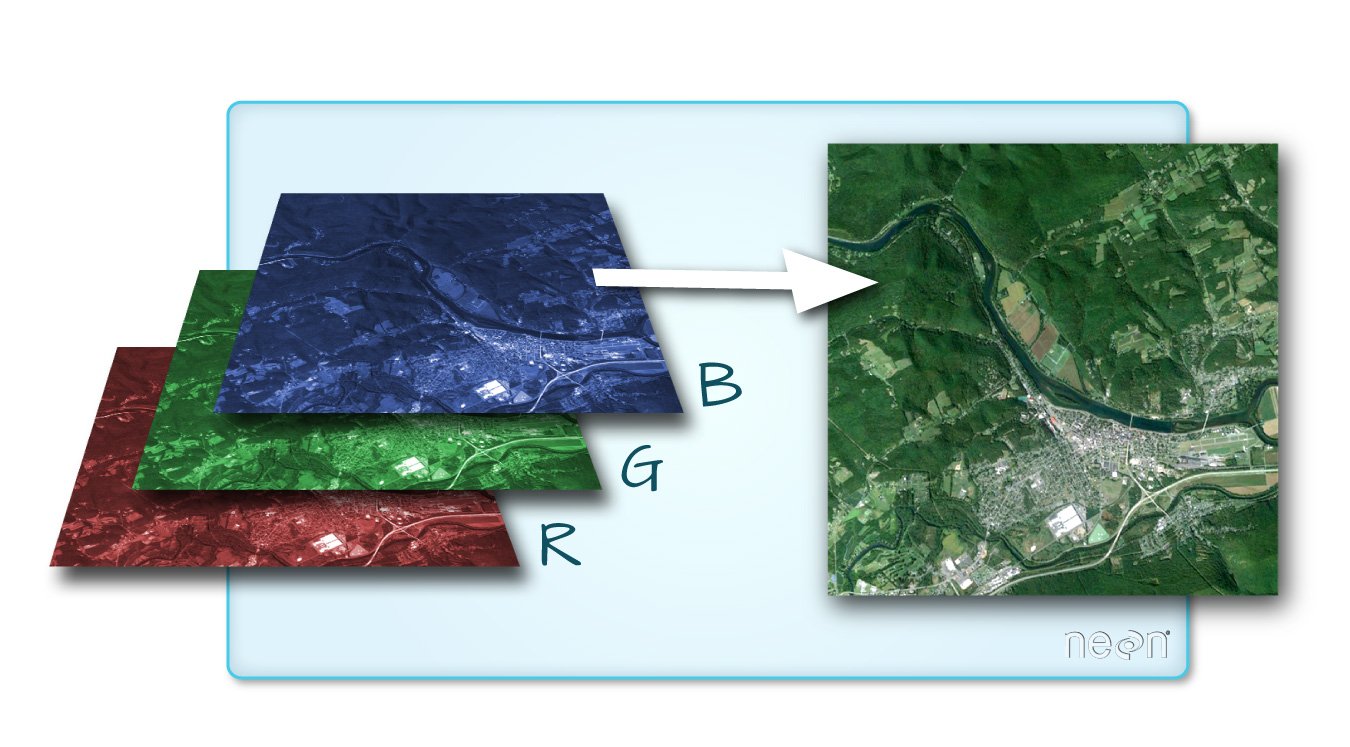
Fonte immagine: documentazione QGIS


import rasterio
import rasterio
src = rasterio.open("DEM_world.tif")
Metadati:
src.count
1
src.width, src.height
(4320, 2160)
array = src.read()
Array numpy standard:
array
array([[[-4290, -4290, -4290, ..., -4290, -4290, -4290],
[-4278, -4278, -4278, ..., -4278, -4278, -4278],
[-4269, -4269, -4269, ..., -4269, -4269, -4269],
...,
[ 2804, 2804, 2804, ..., 2804, 2804, 2804],
[ 2804, 2804, 2804, ..., 2804, 2804, 2804],
[ 2804, 2804, 2804, ..., 2804, 2804, 2804]]], dtype=int16)
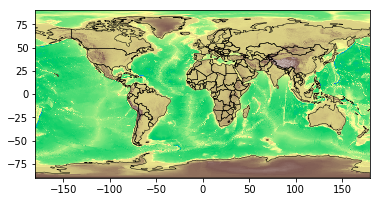
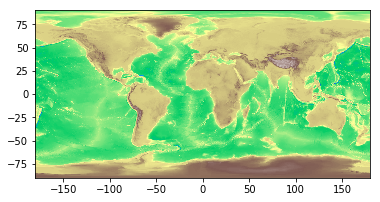
Usare il metodo rasterio.plot.show():
import rasterio.plot
rasterio.plot.show(src, cmap='terrain')

rasterstats: Statistiche riassuntive di dataset raster geospaziali basate su geometrie vettoriali (https://github.com/perrygeo/python-rasterstats)
Per vettori punto:
rasterstats.point_query(geometries, "path/to/raster",
interpolation='nearest'|'bilinear')
Per vettori poligono:
rasterstats.zonal_stats(geometries, "path/to/raster",
stats=['min', 'mean', 'max'])
result = rasterstats.zonal_stats(countries.geometry, "DEM_gworld.tif", stats=['mean'])countries['mean_elevation'] = pd.DataFrame(result)countries.sort_values('mean_elevation', ascending=False).head()
name continent geometry mean_elevation
157 Tajikistan Asia POLYGON ((74.98 37.41, ... 3103.231105
85 Kyrgyzstan Asia POLYGON ((80.25 42.34, ... 2867.717142
24 Bhutan Asia POLYGON ((91.69 27.77, ... 2573.559846
119 Nepal Asia POLYGON ((81.11 30.18, ... 2408.907816
6 Antarctica Antarctica (POLYGON ((-59.57 -80.04... 2374.075028
.. ... ... ... ...
Lavorare con i dati geospaziali in Python