Measures of spread
Introduzione alla statistica in Python

Maggie Matsui
Content Developer, DataCamp
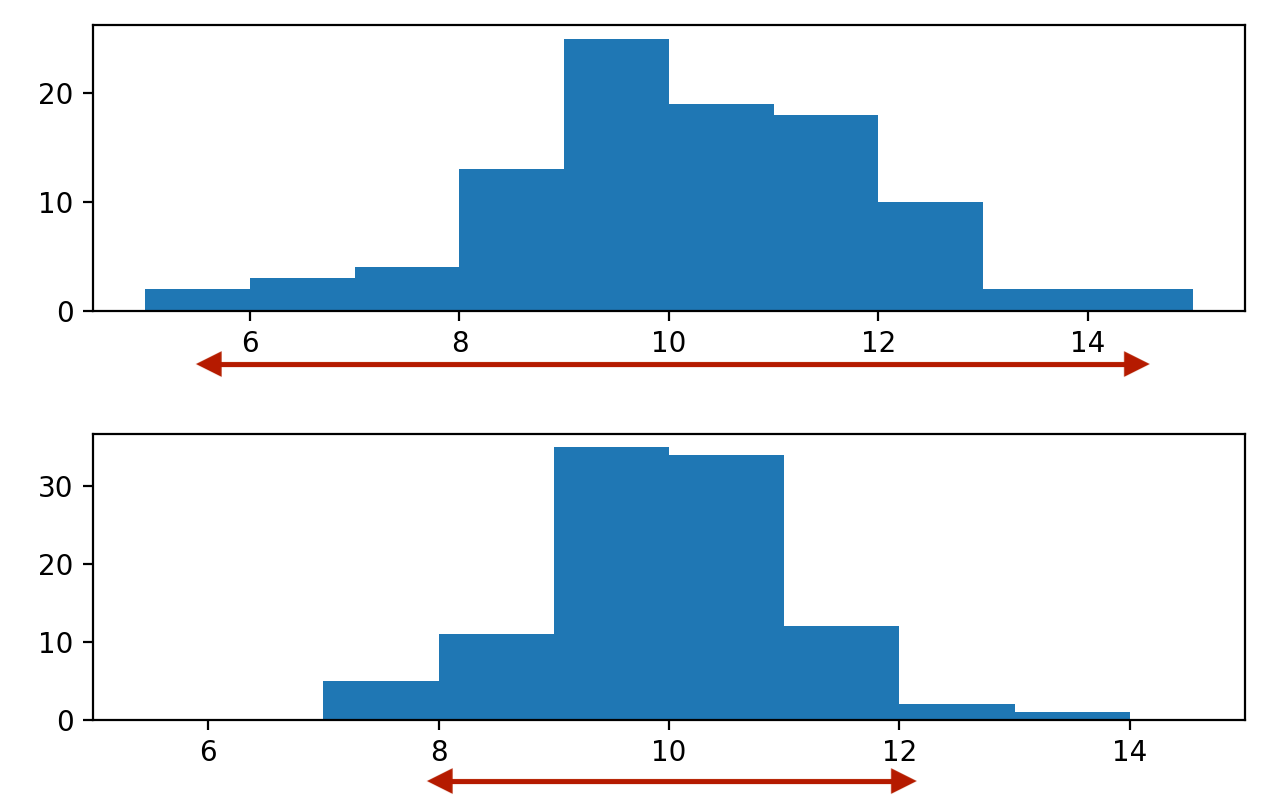
What is spread?
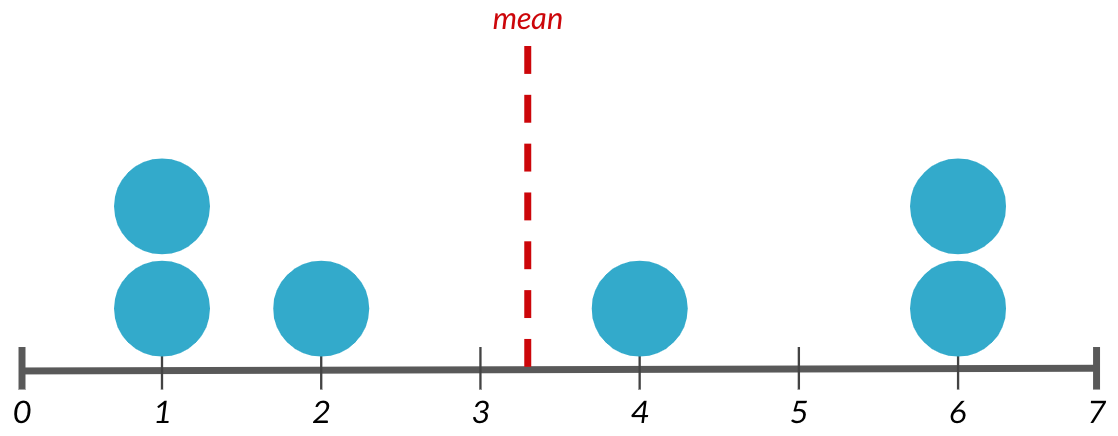
Variance
Average distance from each data point to the data's mean
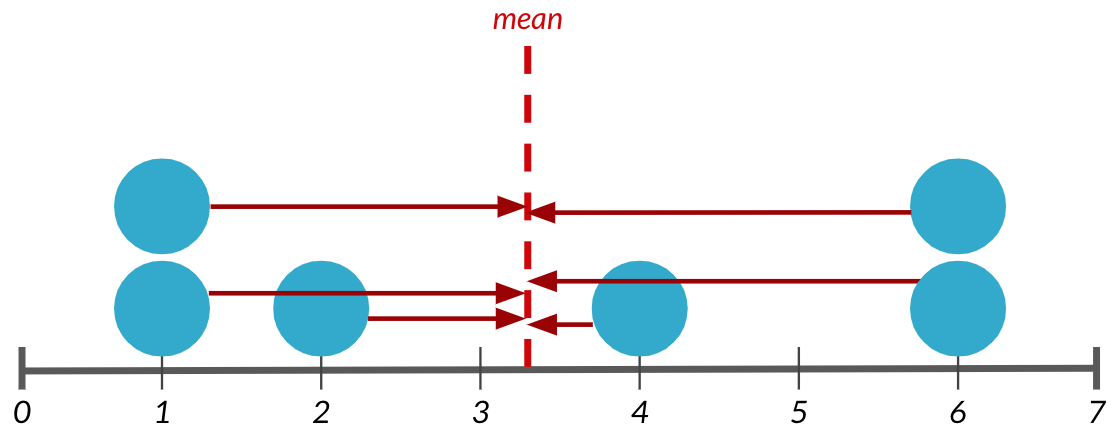
Variance
Average distance from each data point to the data's mean
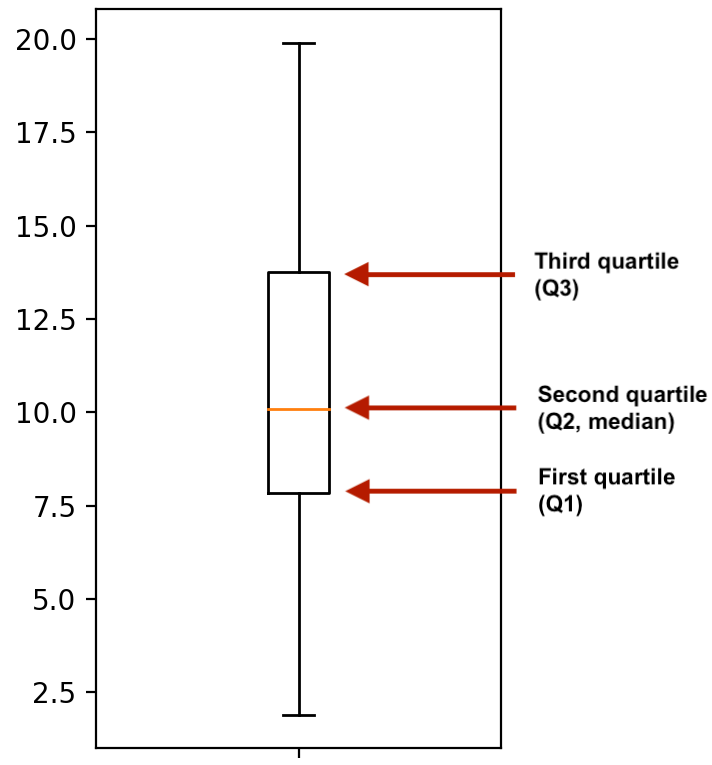
Boxplots use quartiles