Continuous distributions
Introduzione alla statistica in Python

Maggie Matsui
Content Developer, DataCamp
Waiting for the bus
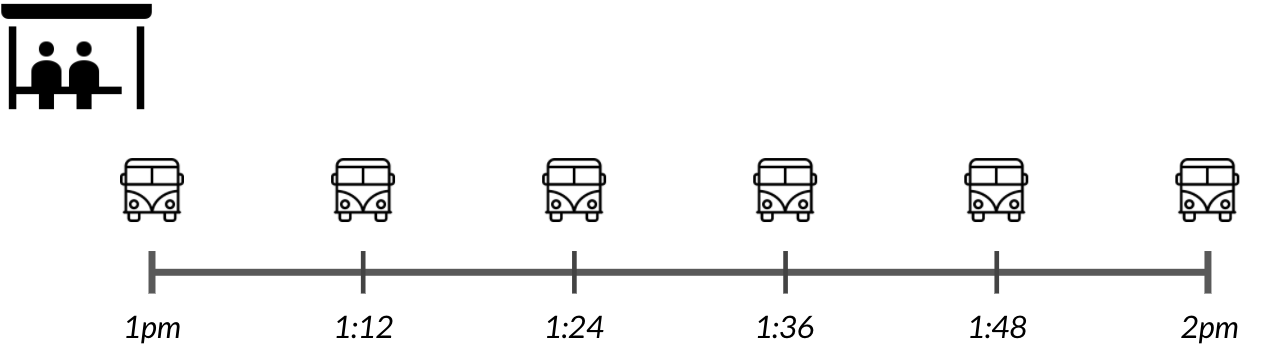
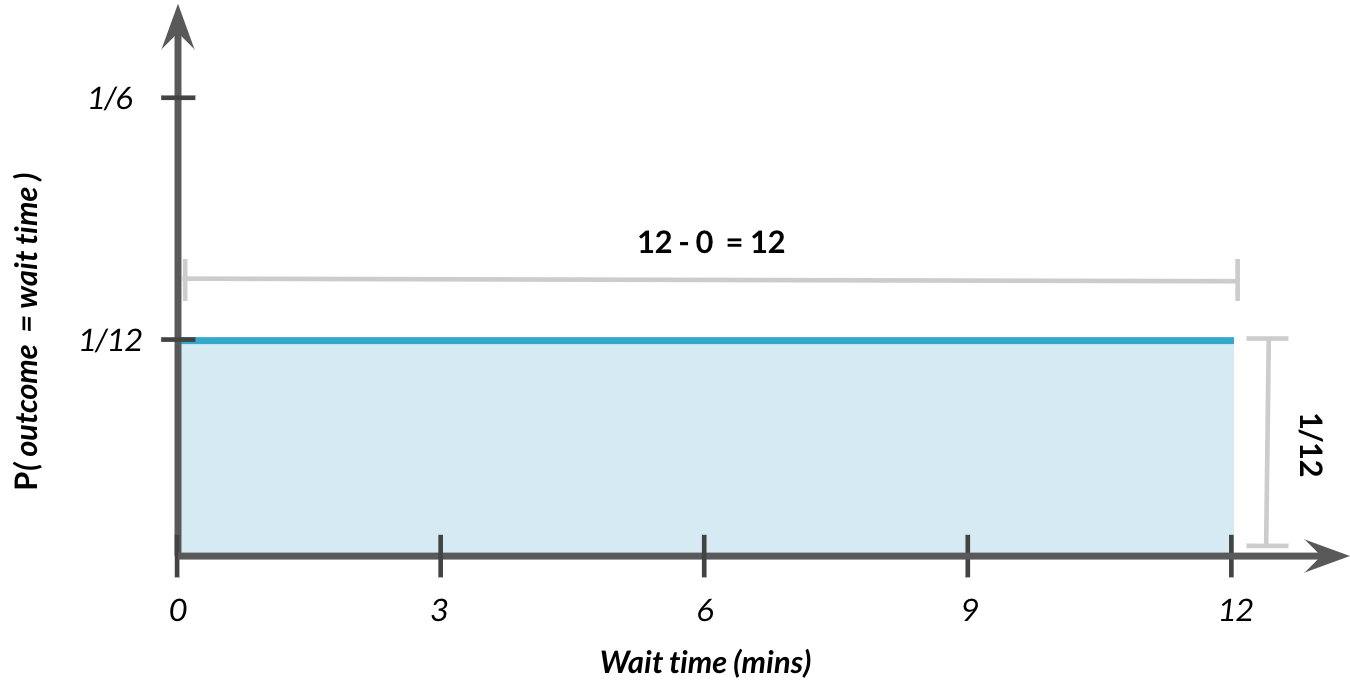
Continuous uniform distribution
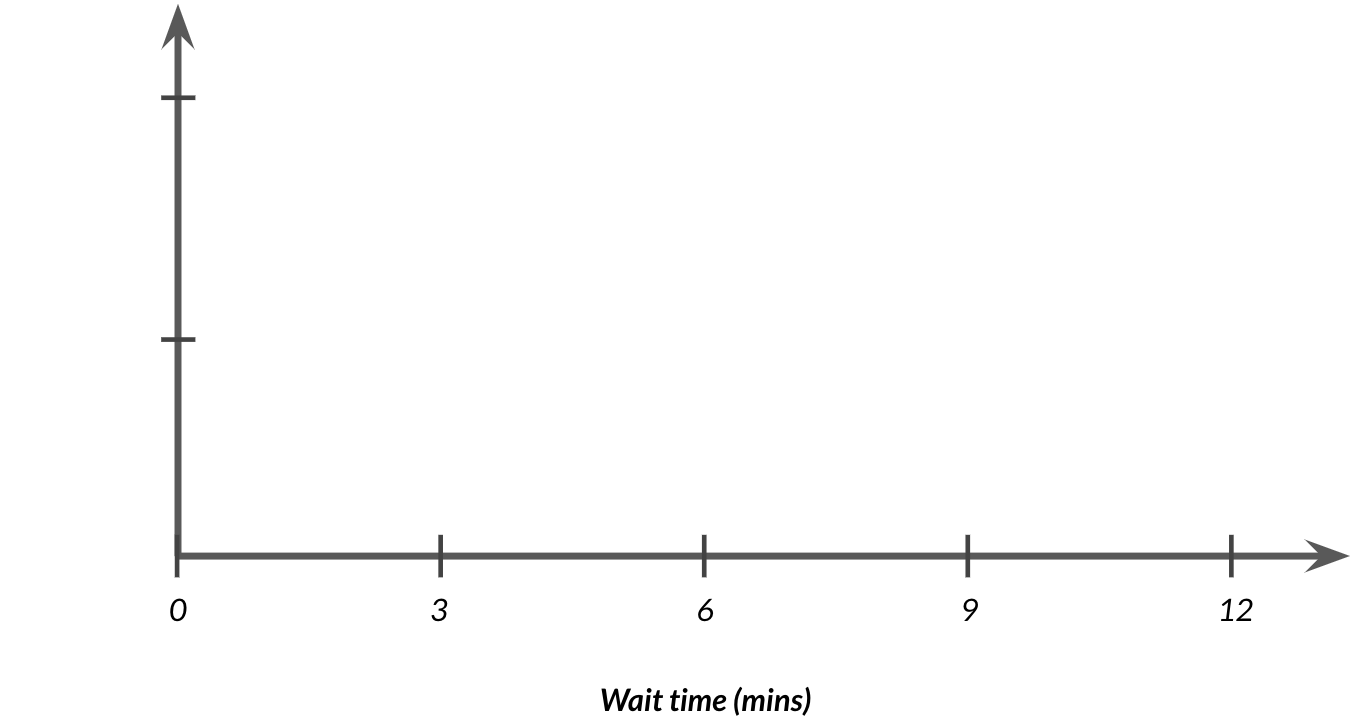
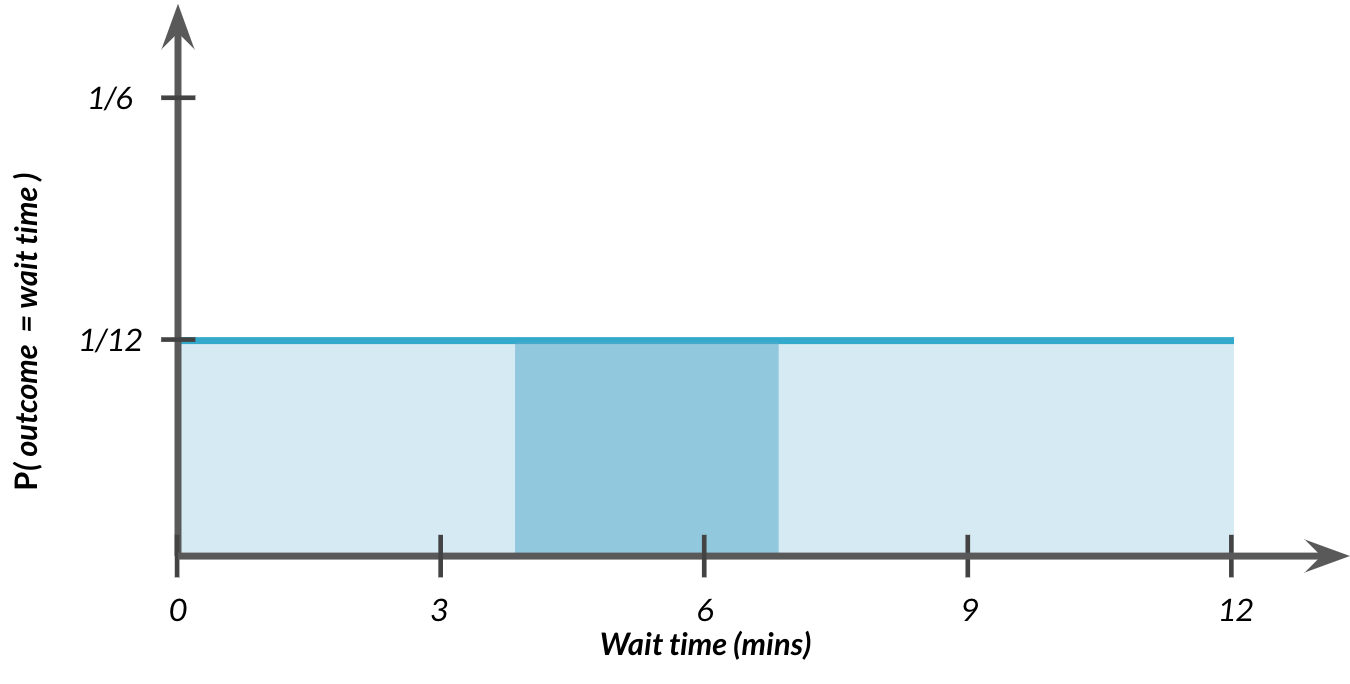
Continuous uniform distribution
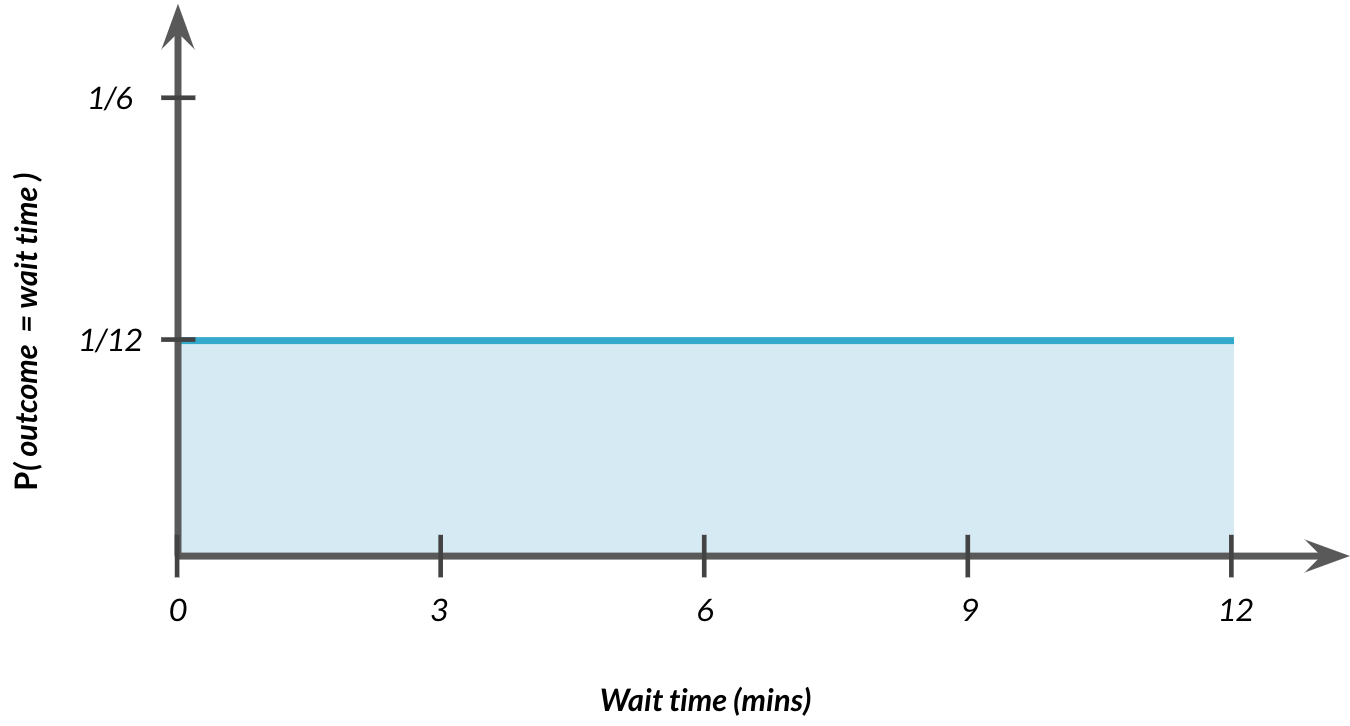
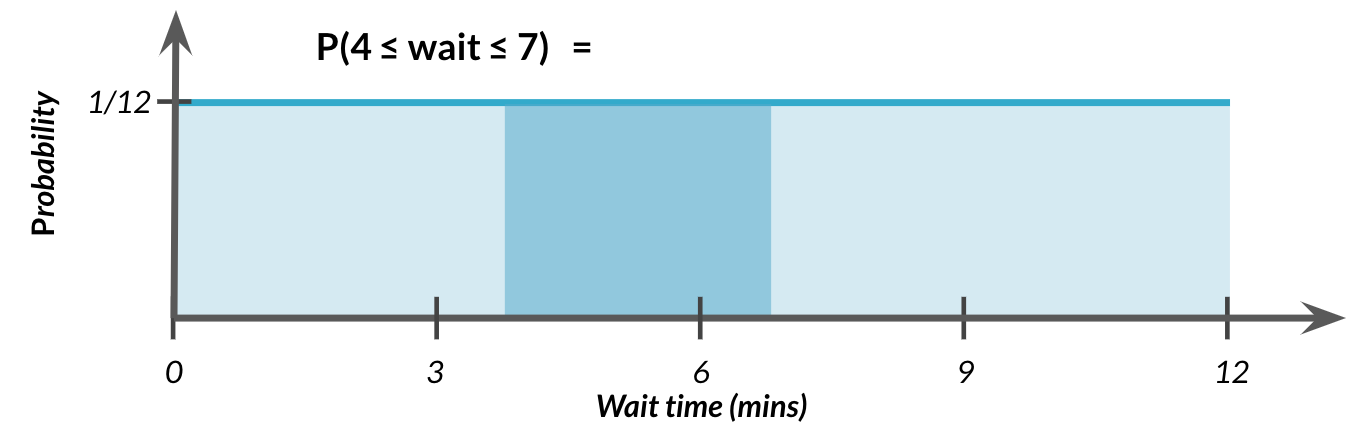
Probability still = area
$$P(4 \le \text{wait time} \le 7) = ~~ ?$$
Probability still = area
$$P(4 \le \text{wait time} \le 7) = ~~ ?$$
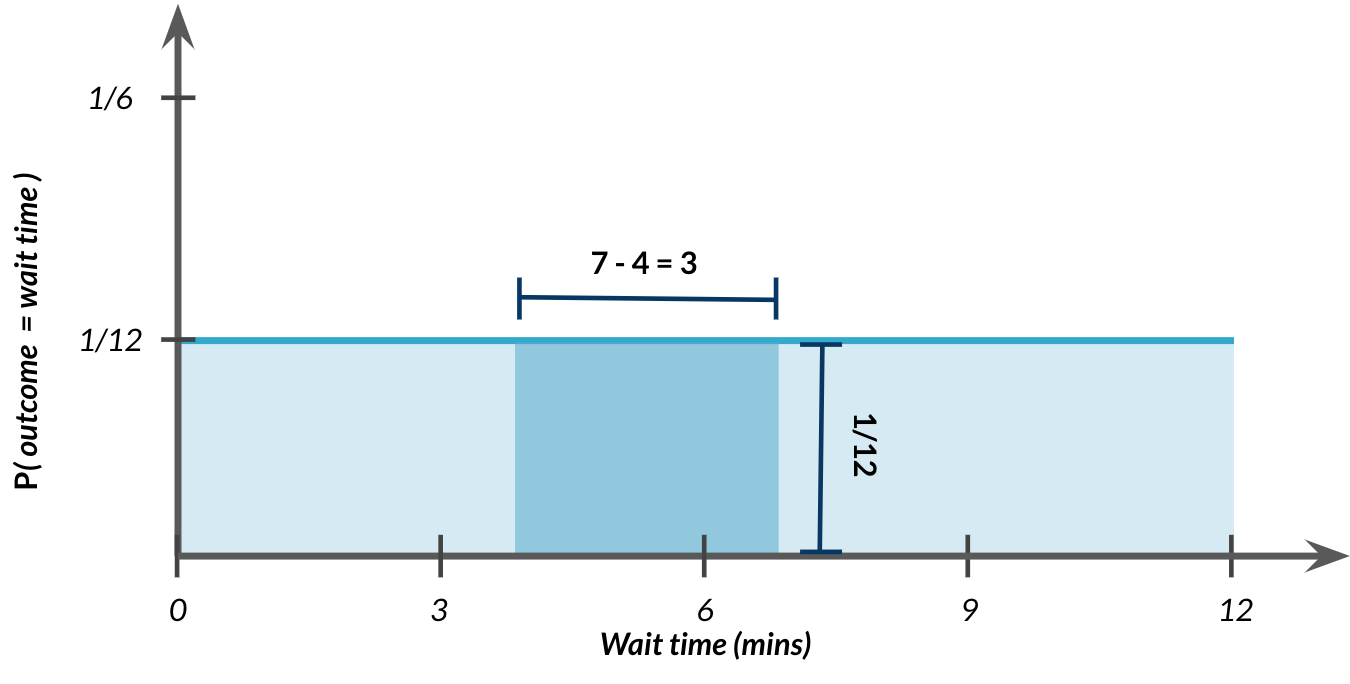
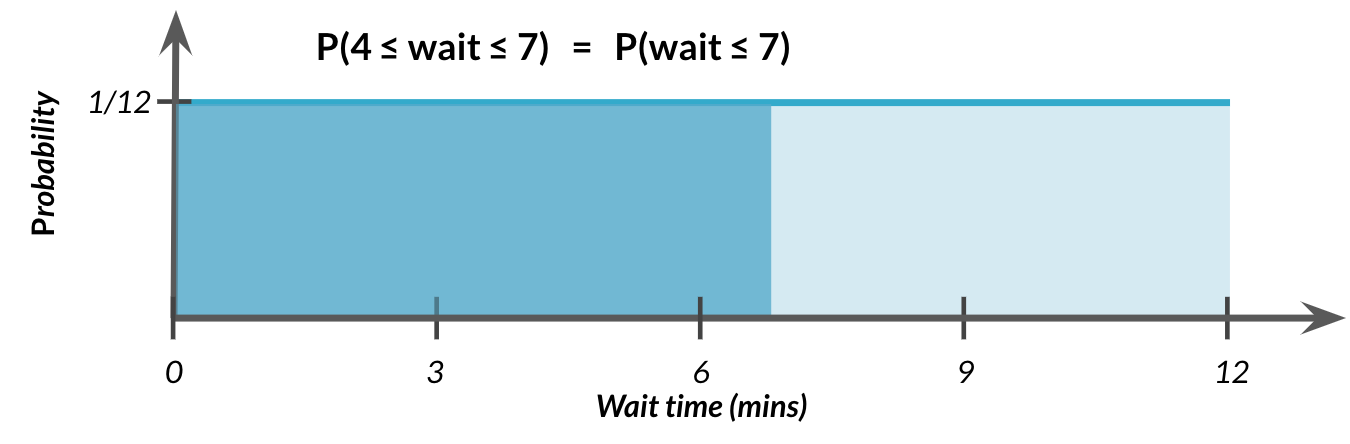
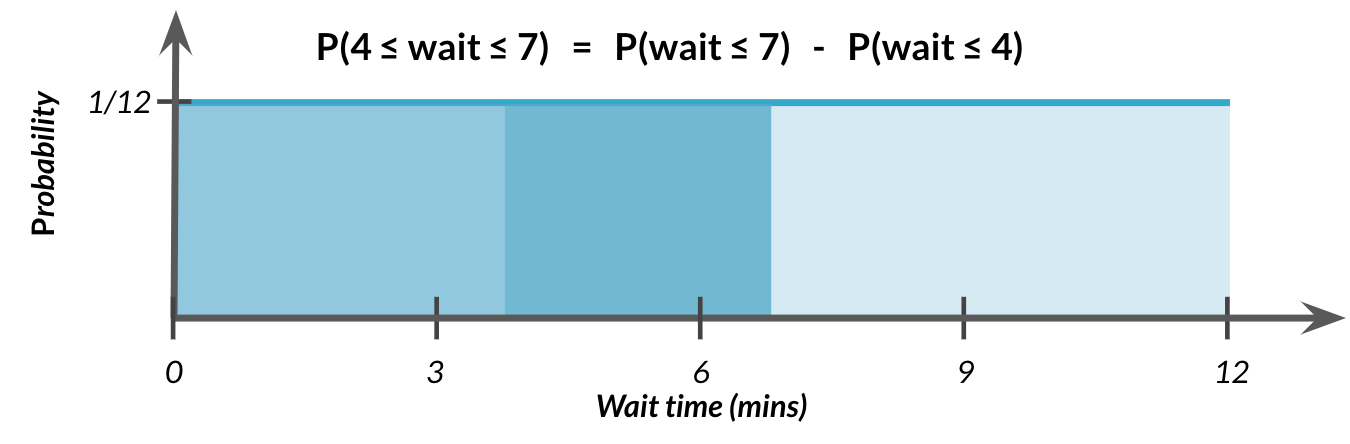
Probability still = area
$$P(4 \le \text{wait time} \le 7) = 3 \times 1/12 = 3/12$$
Uniform distribution in Python
$$ P(\text{wait time} \le 7)$$
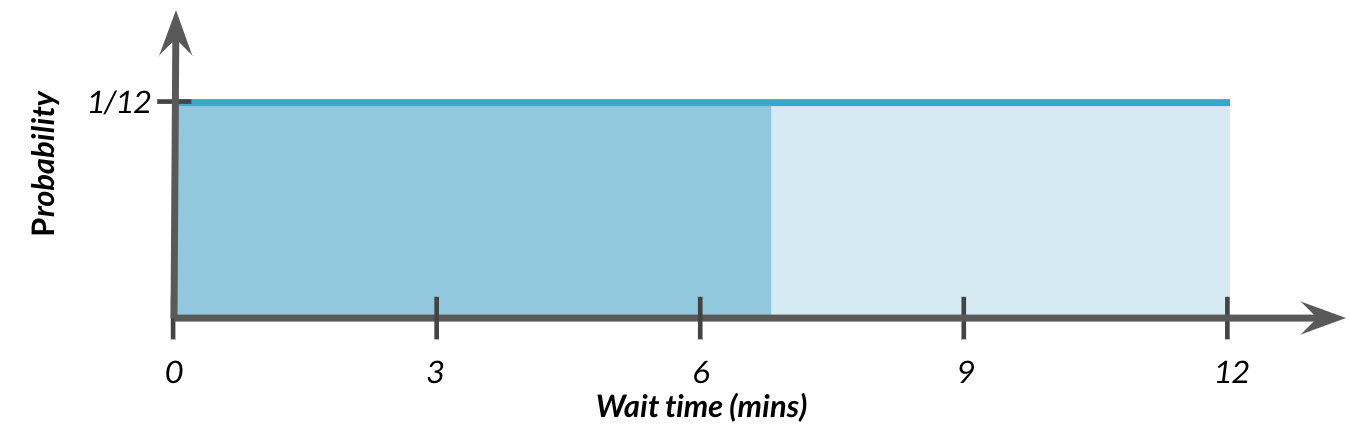
from scipy.stats import uniformuniform.cdf(7, 0, 12)
0.5833333
"Greater than" probabilities
$$ P(\text{wait time} \ge 7) = 1 - P(\text{wait time} \le 7)$$
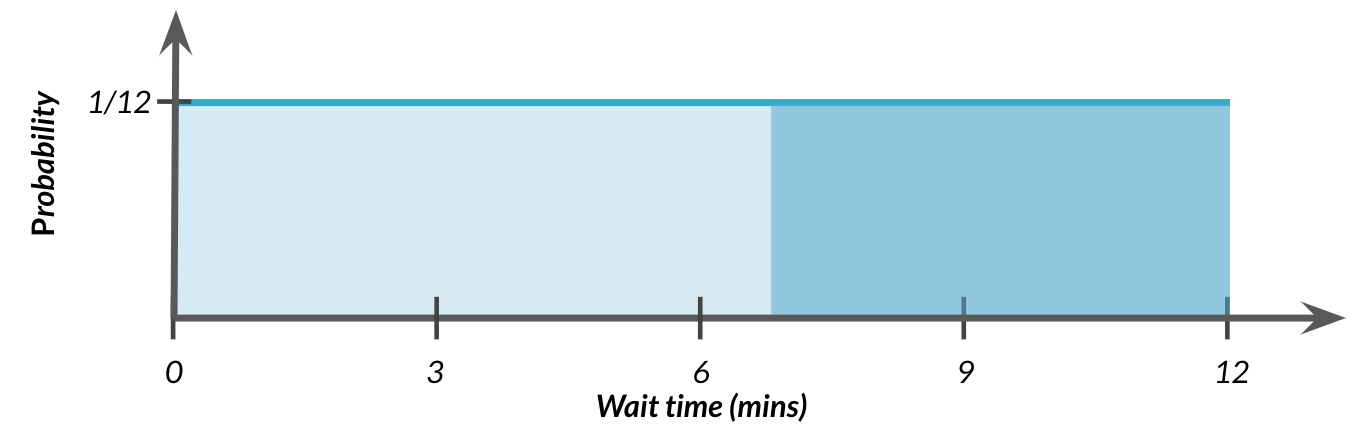
from scipy.stats import uniform
1 - uniform.cdf(7, 0, 12)
0.4166667
$$ P(4 \le \text{wait time} \le 7)$$
$$ P(4 \le \text{wait time} \le 7)$$
$$ P(4 \le \text{wait time} \le 7)$$
from scipy.stats import uniform

uniform.cdf(7, 0, 12) - uniform.cdf(4, 0, 12)
0.25
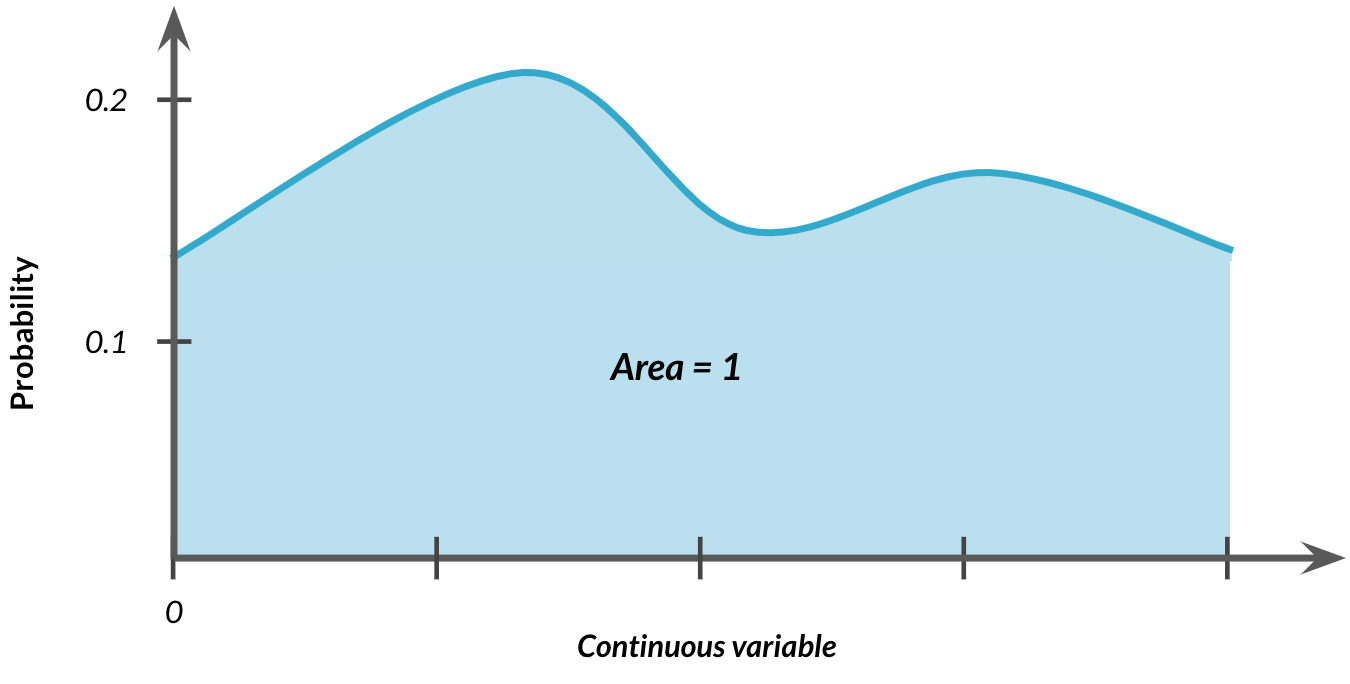
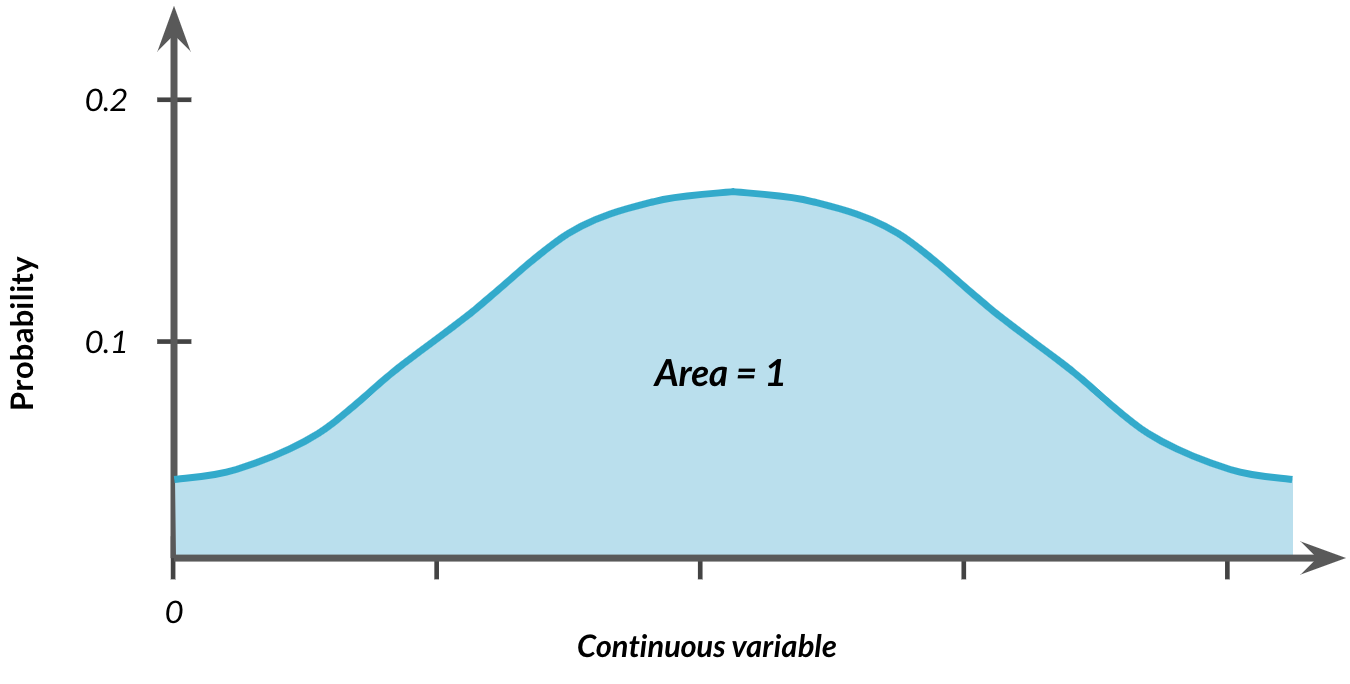
Total area = 1
$$P(0 \le \text{wait time} \le 12) = ~~ ?$$
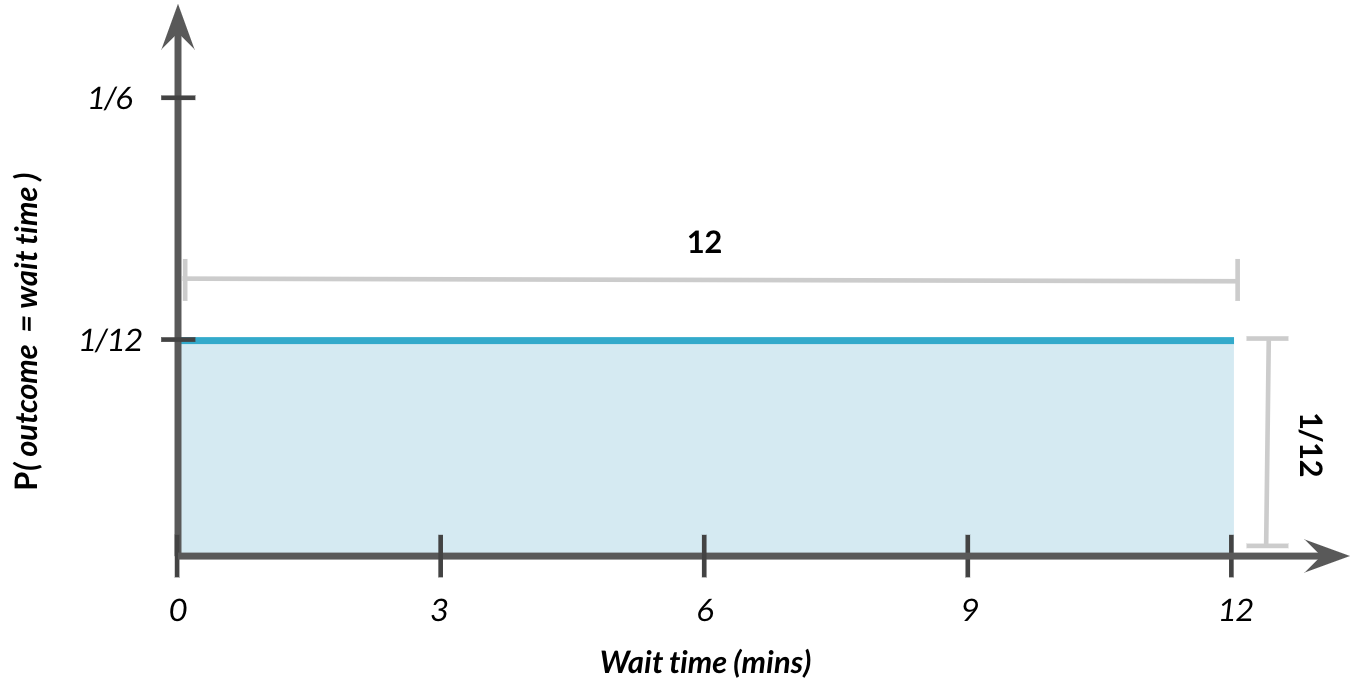
Total area = 1
$$P(0 \le \text{outcome} \le 12) = 12 \times 1/12 = 1$$
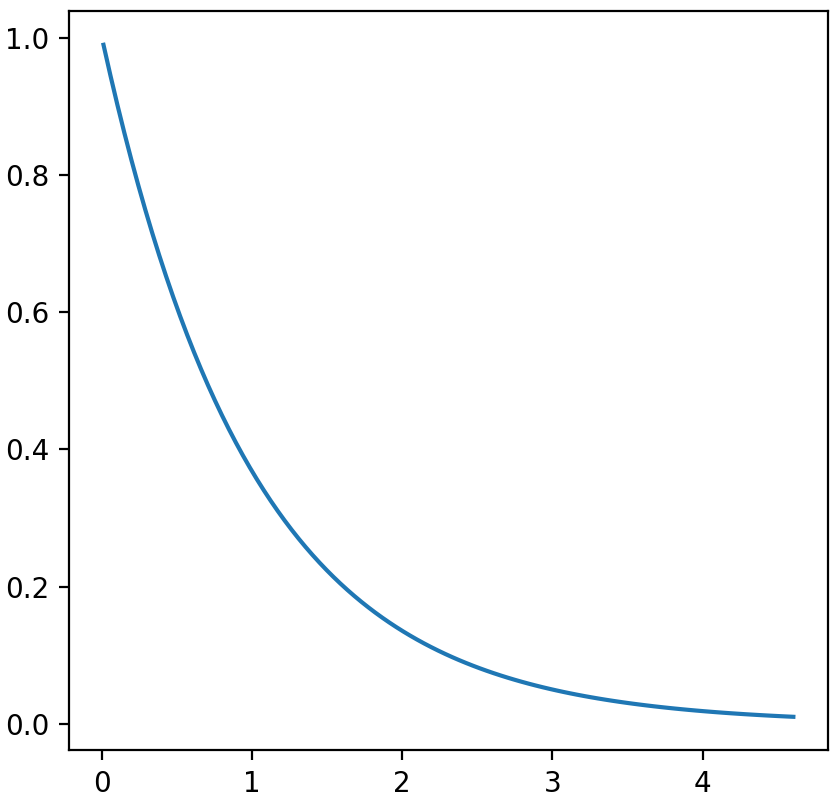
Other continuous distributions
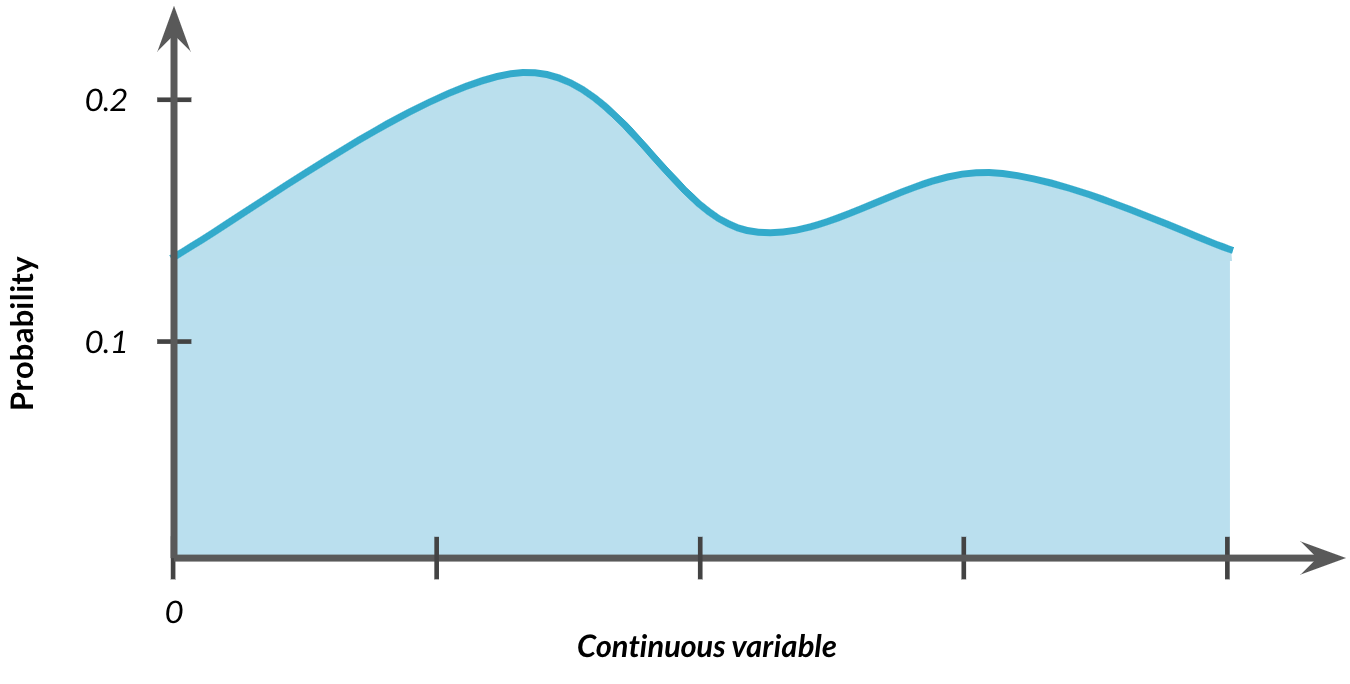
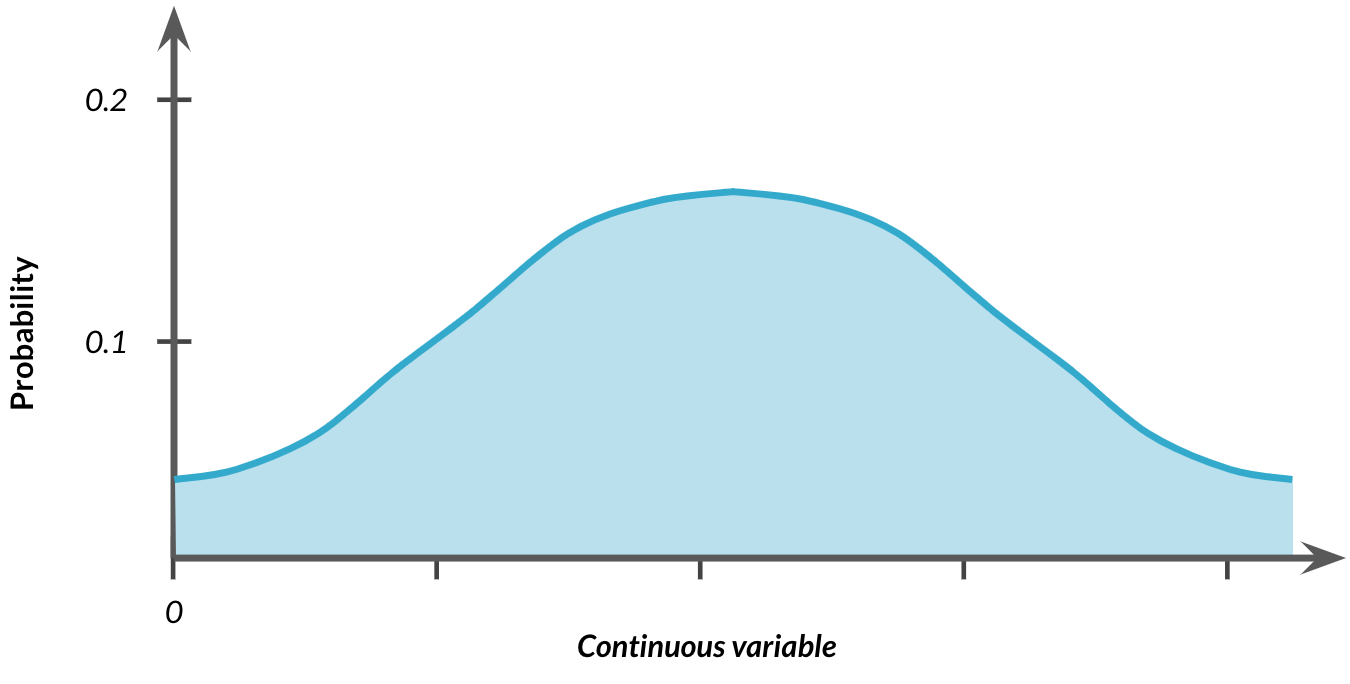
Other continuous distributions
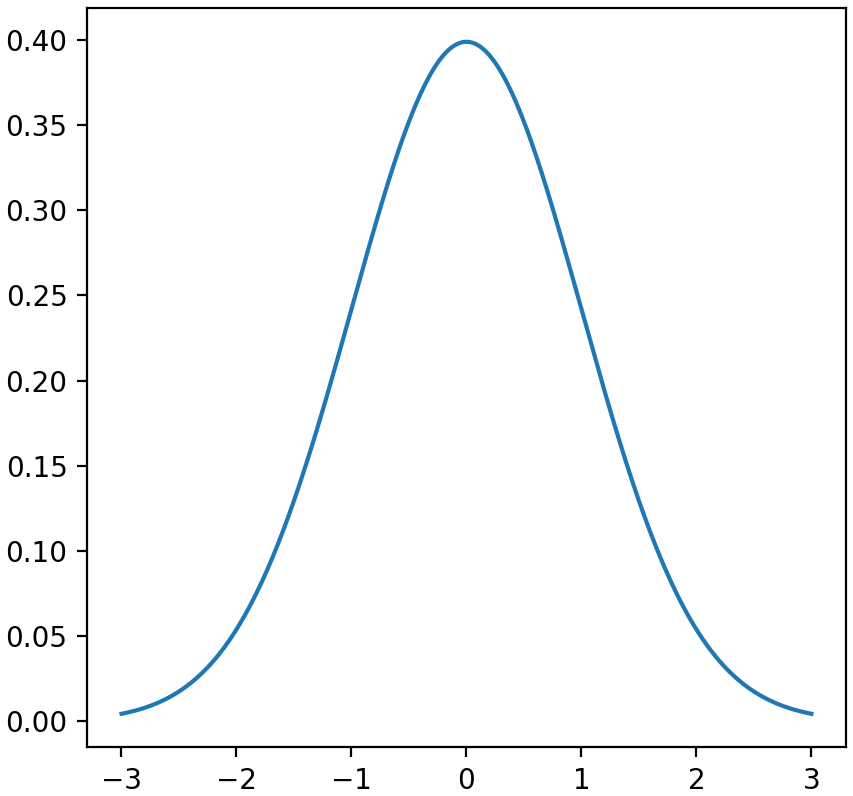
Other special types of distributions
Normal distribution
Exponential distribution