Discrete distributions

Introduzione alla statistica in Python

Maggie Matsui

Content Developer, DataCamp
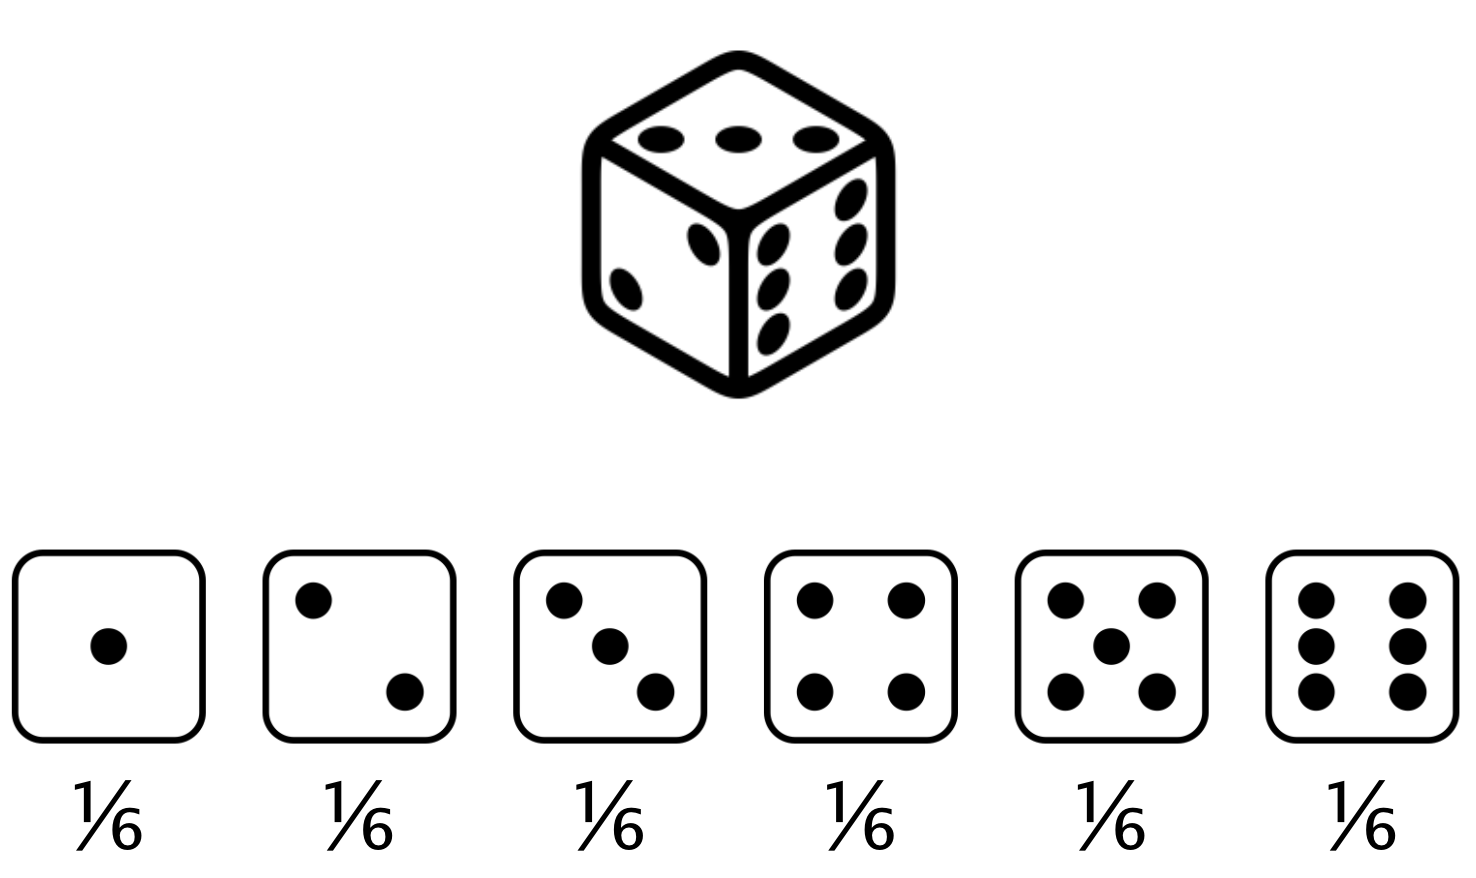
Rolling the dice

Six-sided die

Introduzione alla statistica in Python

Rolling the dice

Each side of a die has 1/6 probability

Introduzione alla statistica in Python

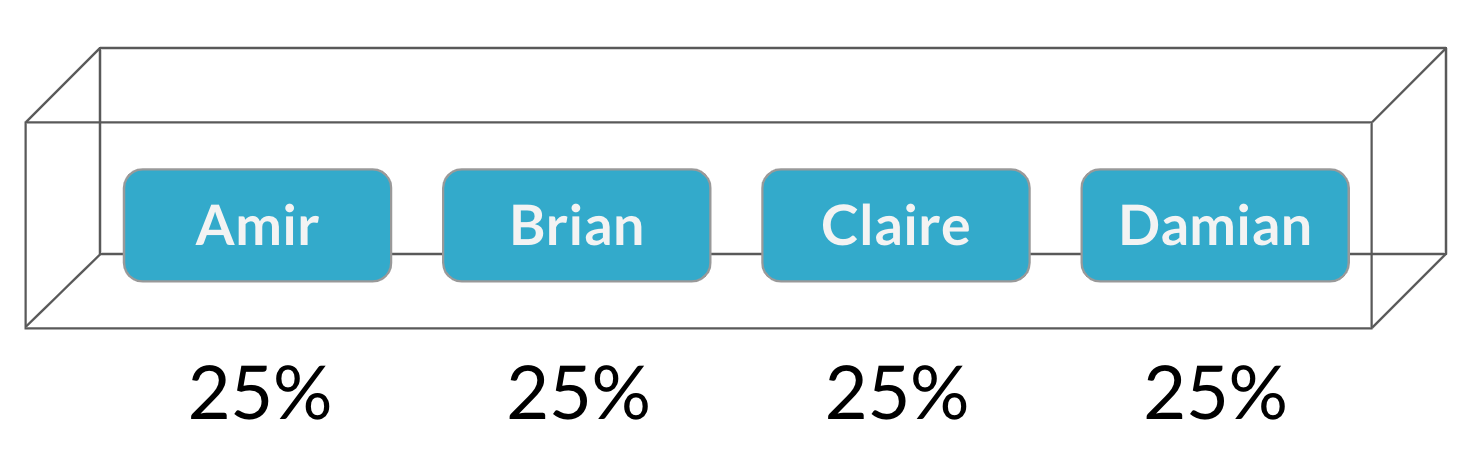
Choosing salespeople


Names in a box, each with 25% probability

Introduzione alla statistica in Python

Probability distribution

Describes the probability of each possible outcome in a scenario

Each side of a die has 1/6 probability


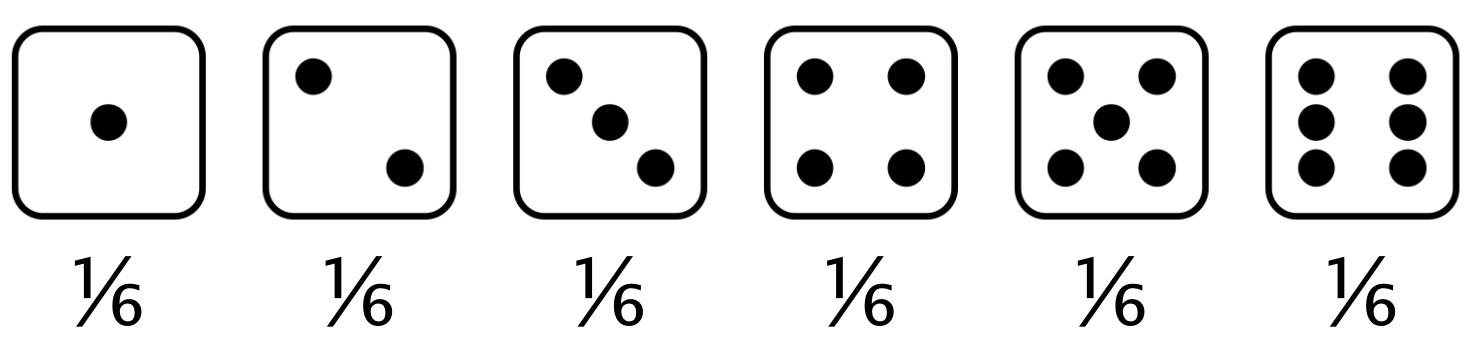
Expected value: mean of a probability distribution

Expected value of a fair die roll = $(1 \times \frac{1}{6}) + (2 \times \frac{1}{6}) +(3 \times \frac{1}{6}) +(4 \times \frac{1}{6}) +(5 \times \frac{1}{6}) +(6 \times \frac{1}{6}) = 3.5$

Introduzione alla statistica in Python

Visualizing a probability distribution
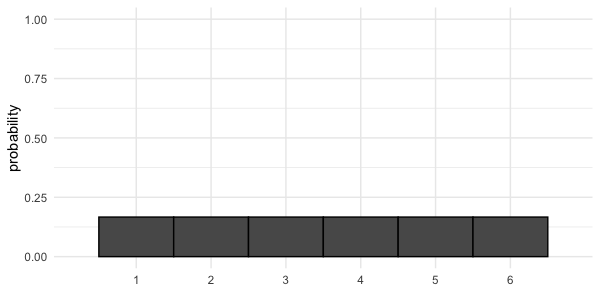
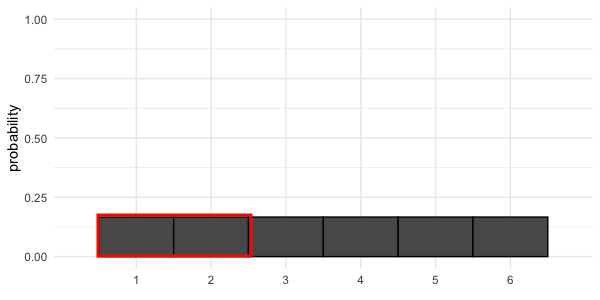
Bar plot with a bar for each number 1 through six, with height 1/6.

Introduzione alla statistica in Python

Probability = area

$$P(\text{die roll}) \le 2 = ~?$$
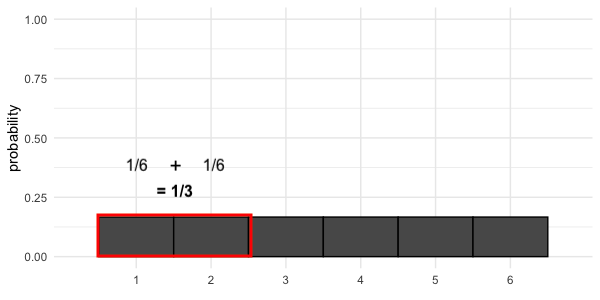
Bars for 1 and 2 highlighted

Introduzione alla statistica in Python

Probability = area

$$P(\text{die roll}) \le 2 = 1/3$$

1/6 + 1/6 = 1/3

Introduzione alla statistica in Python

Uneven die

six-sided die with two sides with 3 dots

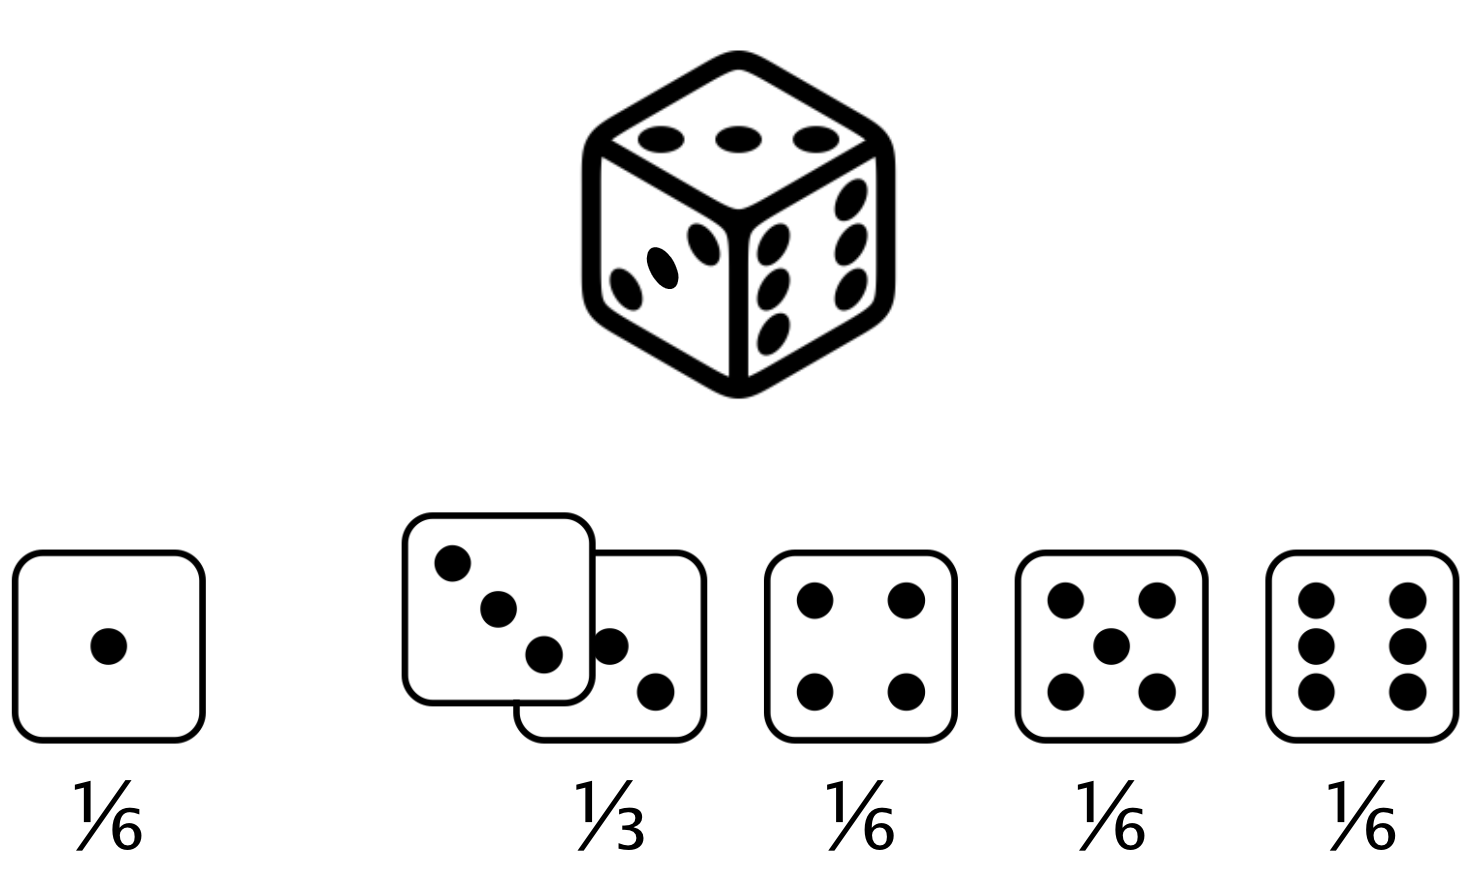
Expected value of uneven die roll = $(1 \times \frac{1}{6}) +(2 \times 0) +(3 \times \frac{1}{3}) +(4 \times \frac{1}{6}) +(5 \times \frac{1}{6}) +(6 \times \frac{1}{6}) = 3.67$

Introduzione alla statistica in Python

Visualizing uneven probabilities
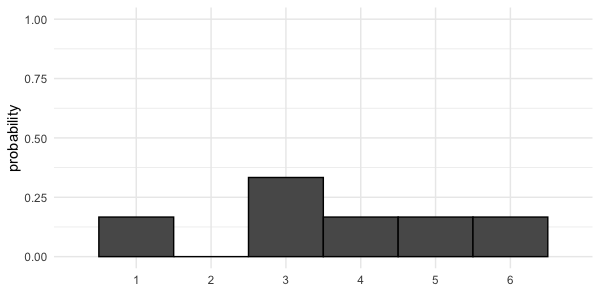
Probability distribution of uneven die. Bars for 1, 4, 5, 6 are height 1/6, bar for 2 is height 0, bar for 3 is height 1/3

Introduzione alla statistica in Python

Adding areas

$$P(\text{uneven die roll}) \le 2 = ~?$$
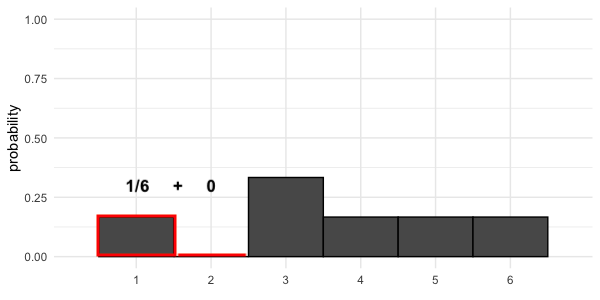
1/6 + 0

Introduzione alla statistica in Python

Adding areas

$$P(\text{uneven die roll}) \le 2 = 1/6$$

1/6 + 0

Introduzione alla statistica in Python

Discrete probability distributions

Describe probabilities for discrete outcomes

Fair die

Fair die plot

                 Discrete uniform distribution


Uneven die

Uneven die plot

Introduzione alla statistica in Python

Sampling from discrete distributions

print(die)
  number      prob
0      1  0.166667
1      2  0.166667
2      3  0.166667
3      4  0.166667
4      5  0.166667
5      6  0.166667
np.mean(die['number'])
3.5
rolls_10 = die.sample(10, replace = True)
rolls_10
  number      prob
0      1  0.166667
0      1  0.166667
4      5  0.166667
1      2  0.166667
0      1  0.166667
0      1  0.166667
5      6  0.166667
5      6  0.166667
...
Introduzione alla statistica in Python

Visualizing a sample

rolls_10['number'].hist(bins=np.linspace(1,7,7)) 
plt.show()

histogram of 10 rolls

Introduzione alla statistica in Python

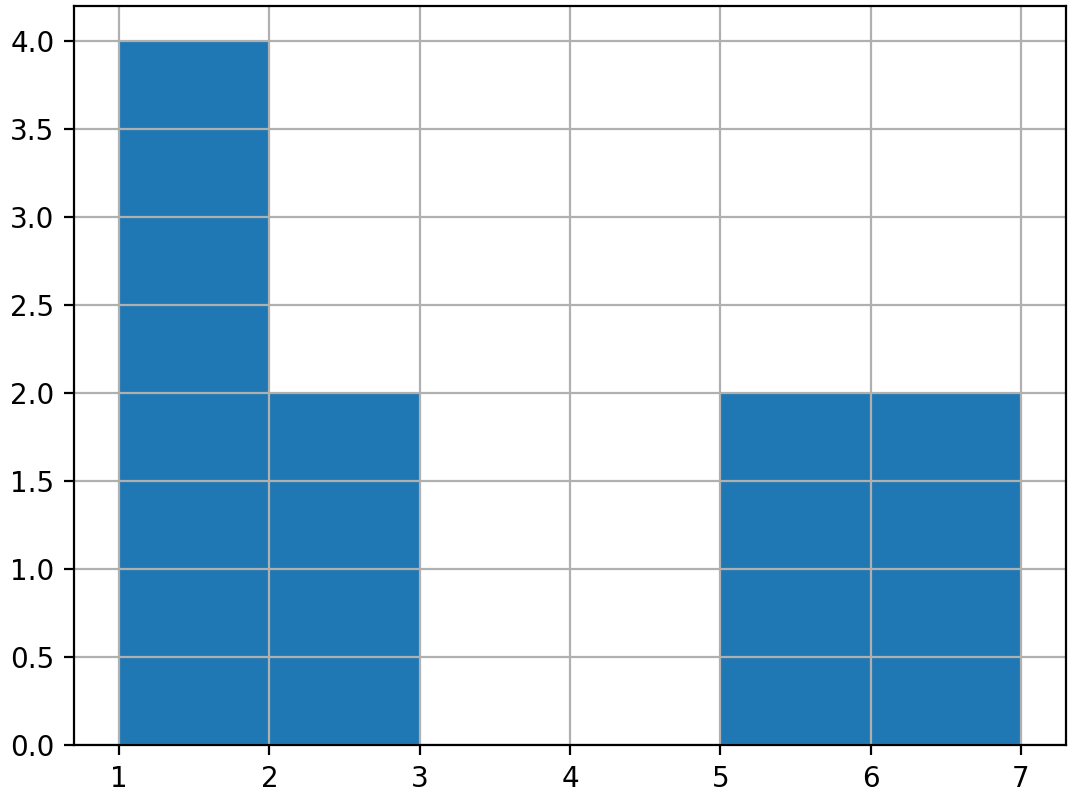
Sample distribution vs. theoretical distribution

Sample of 10 rolls

histogram of 10 rolls

np.mean(rolls_10['number']) = 3.0

Theoretical probability distribution


probability distribution of fair die

mean(die['number']) = 3.5

Introduzione alla statistica in Python

A bigger sample

Sample of 100 rolls

histogram of 100 rolls

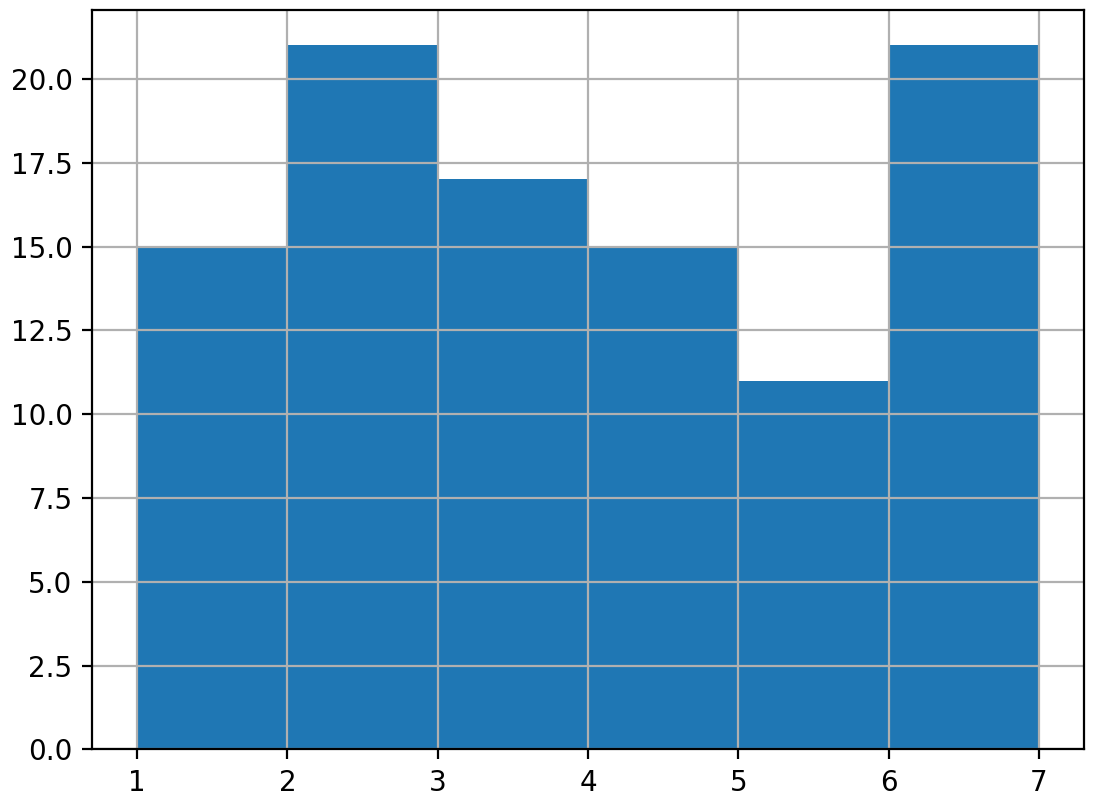
np.mean(rolls_100['number']) = 3.4

Theoretical probability distribution


probability distribution of fair die

mean(die['number']) = 3.5

Introduzione alla statistica in Python

An even bigger sample

Sample of 1000 rolls

histogram of 1000 rolls

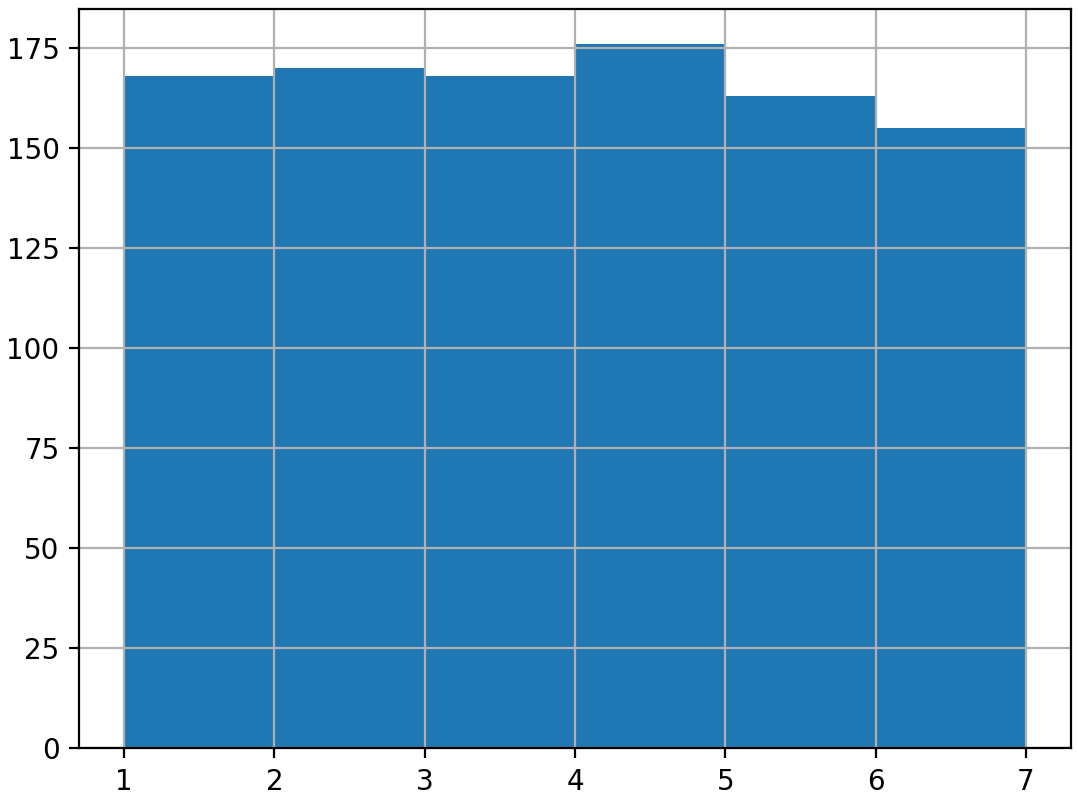
np.mean(rolls_1000['number']) = 3.48

Theoretical probability distribution


probability distribution of fair die

mean(die['number']) = 3.5

Introduzione alla statistica in Python

Law of large numbers

As the size of your sample increases, the sample mean will approach the expected value.

Sample size Mean
10 3.00
100 3.40
1000 3.48
Introduzione alla statistica in Python

Let's practice!

Introduzione alla statistica in Python

Preparing Video For Download...