Distribuzioni continue
Introduzione alla statistica

George Boorman
Curriculum Manager, DataCamp
Aspettare l’autobus
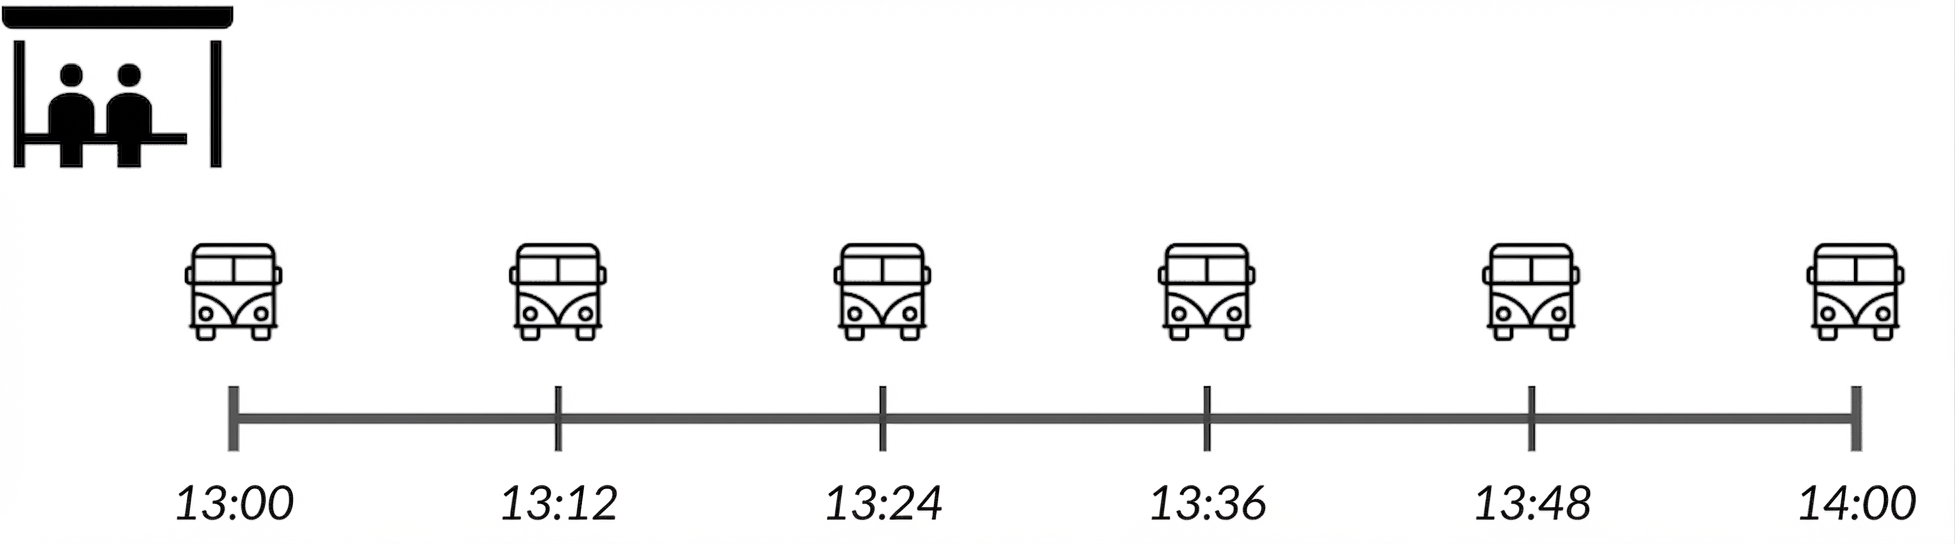
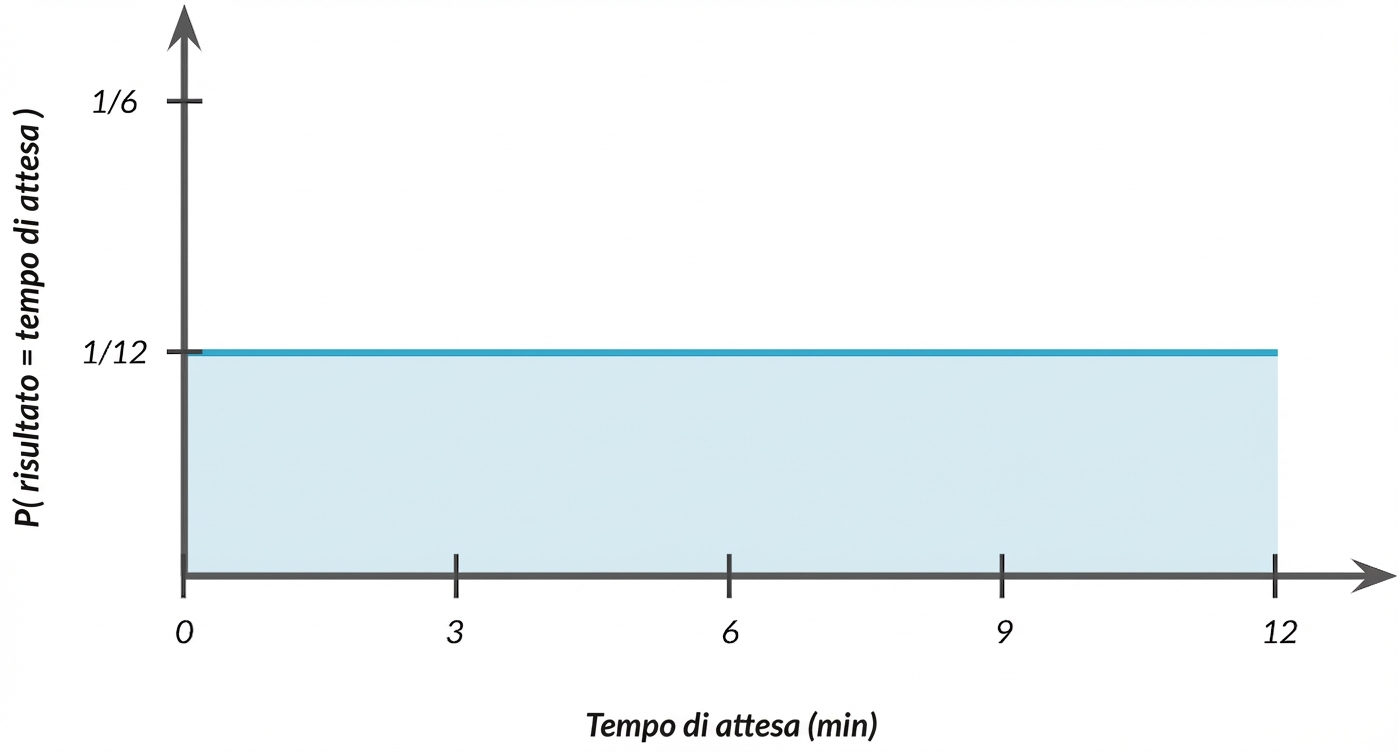
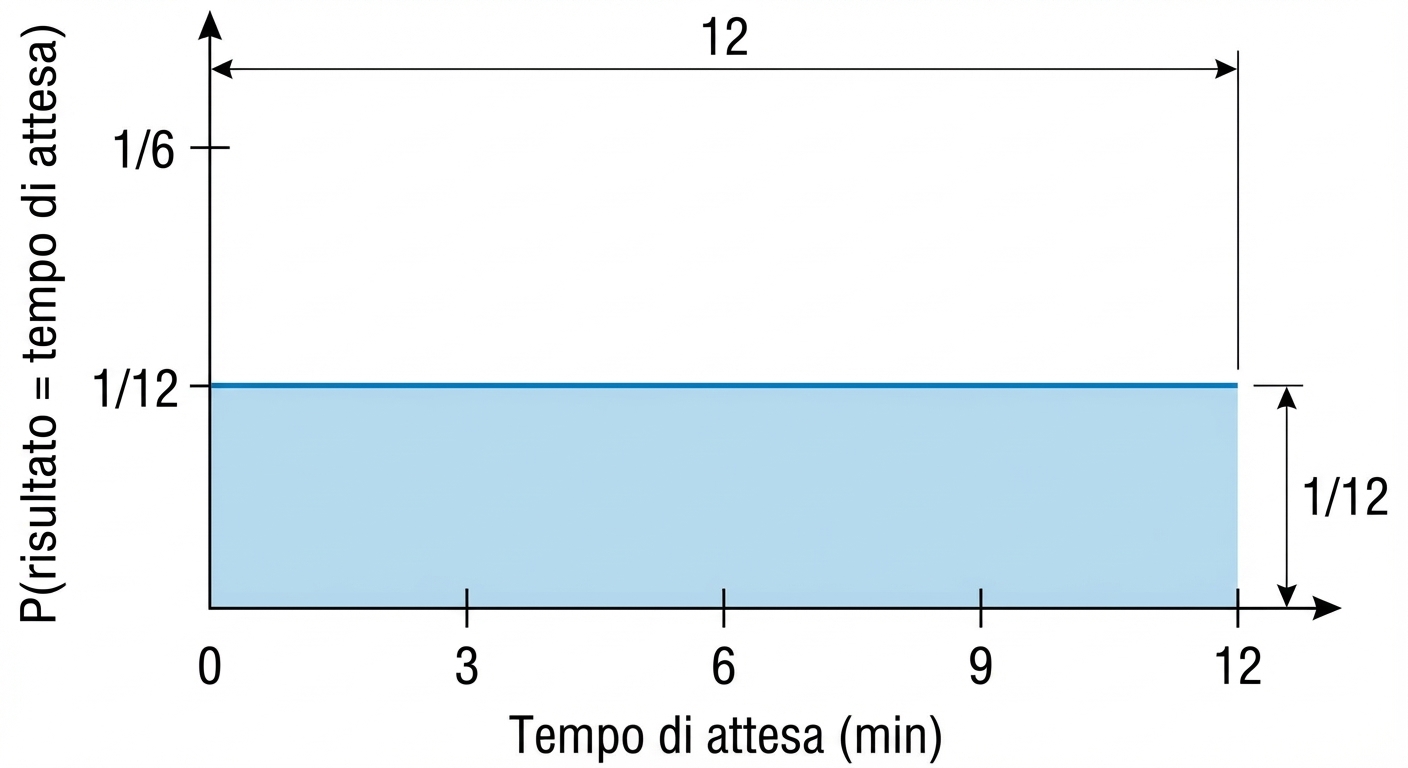
Distribuzione uniforme continua
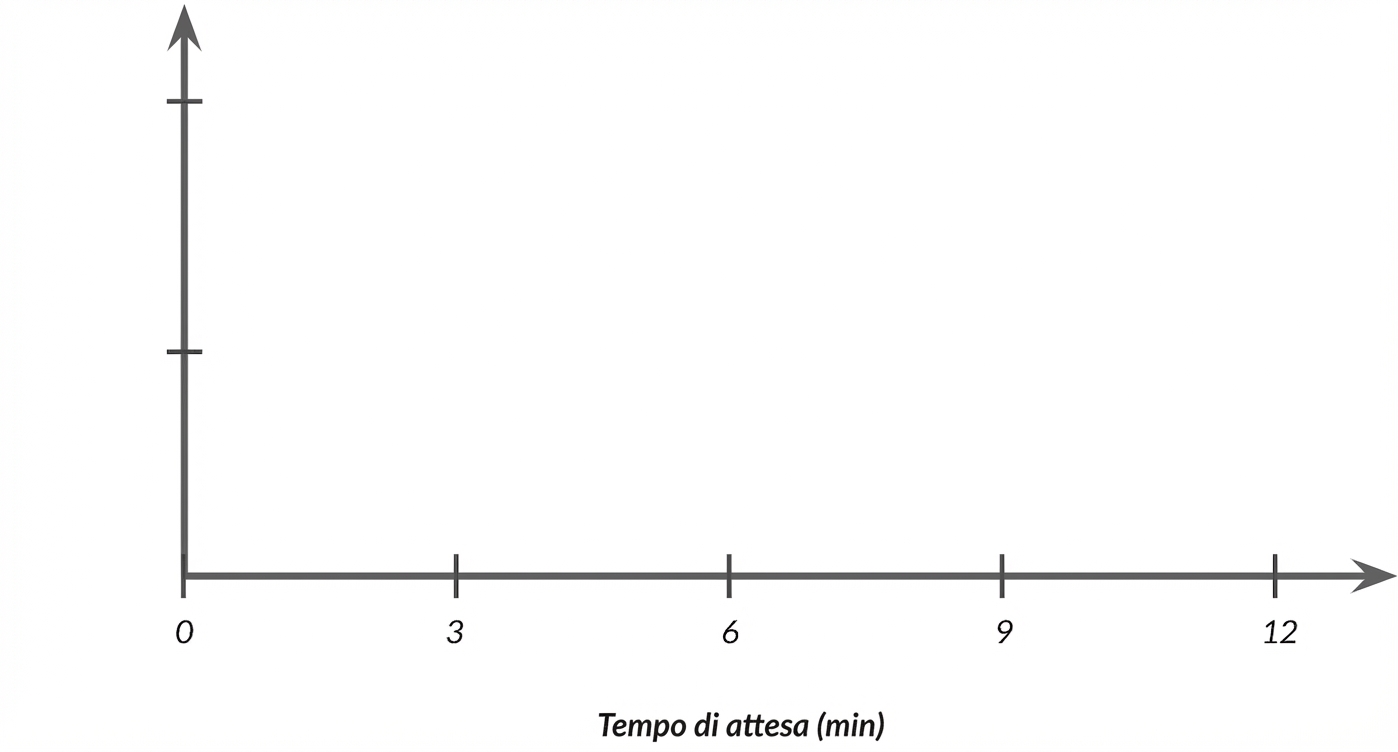
Distribuzione uniforme continua
Probabilità = area (ancora)
$$P(4 \le \text{wait time} \le 7) = ~~ ?$$
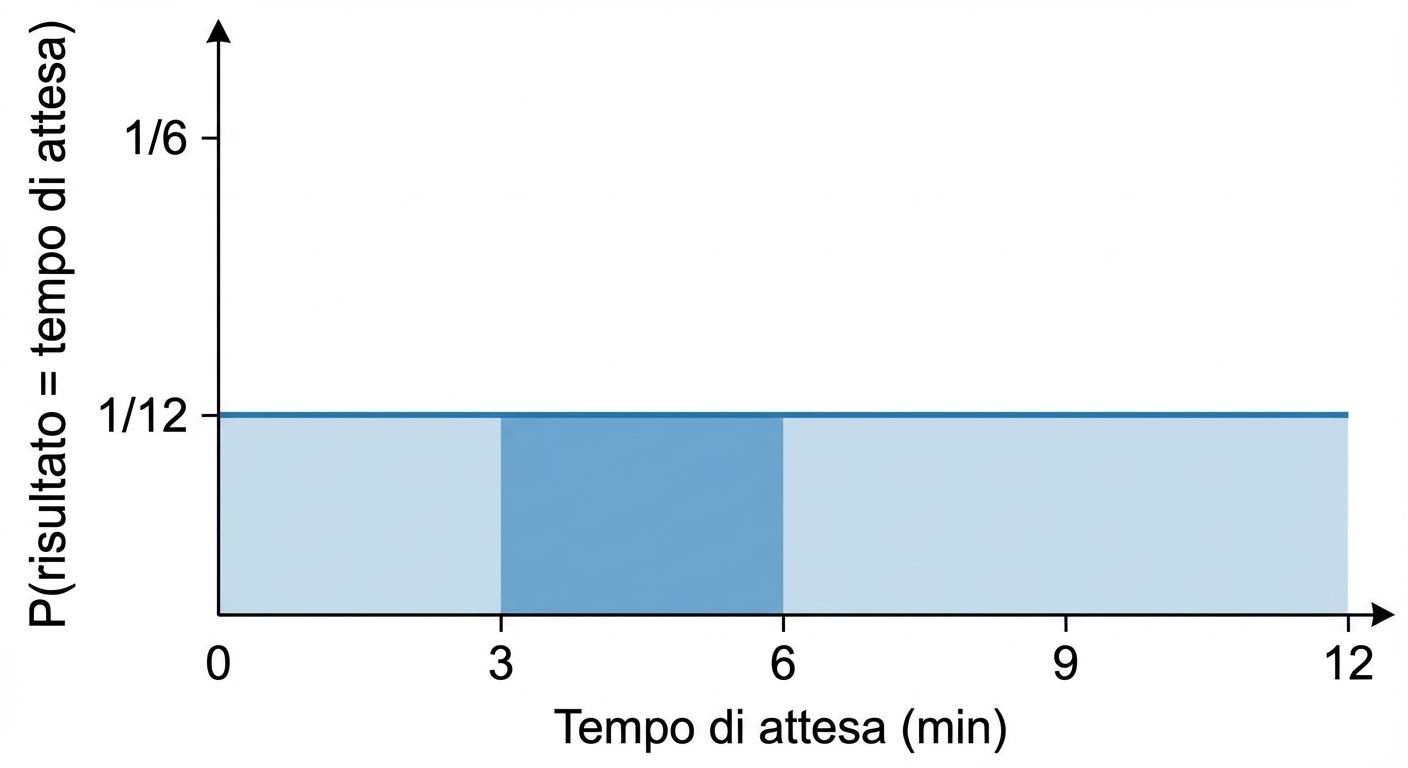
Probabilità = area (ancora)
$$P(4 \le \text{wait time} \le 7) = ~~ ?$$
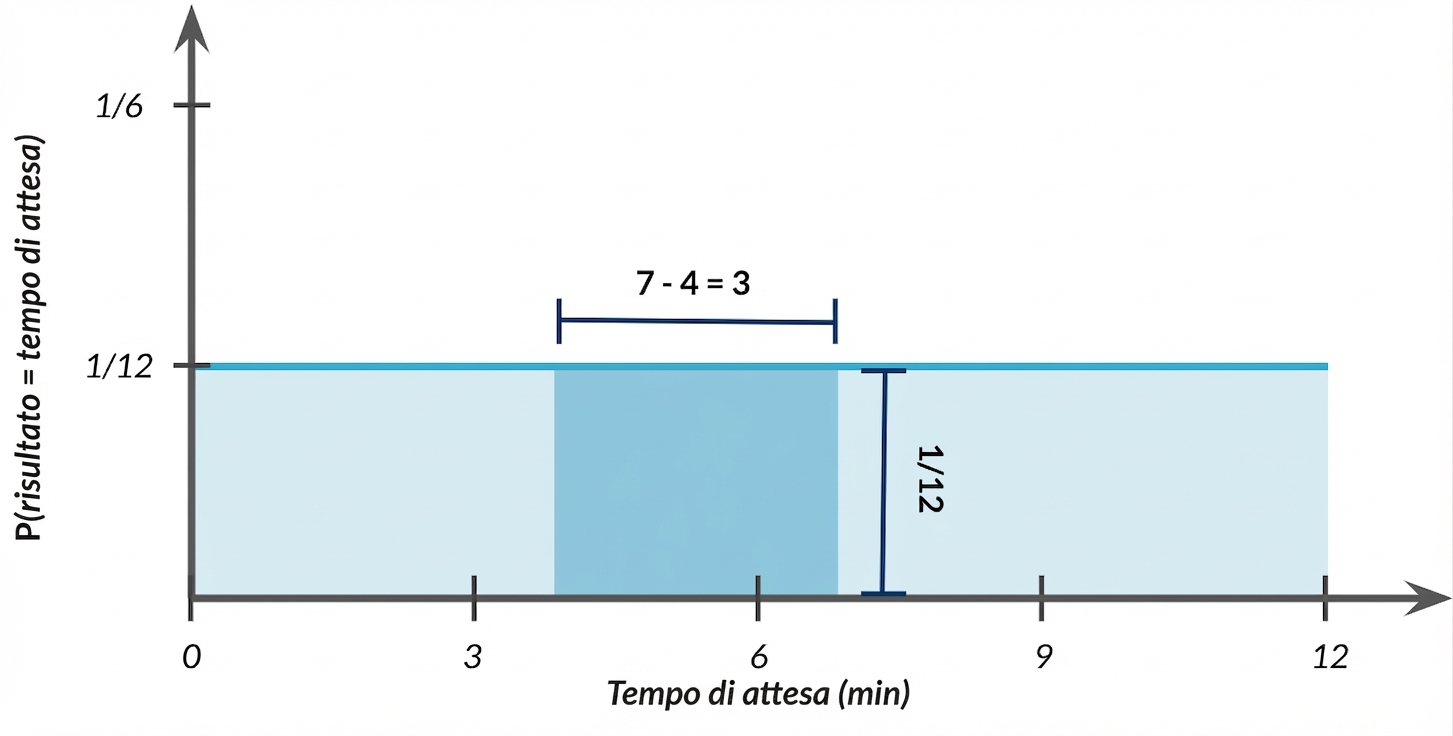
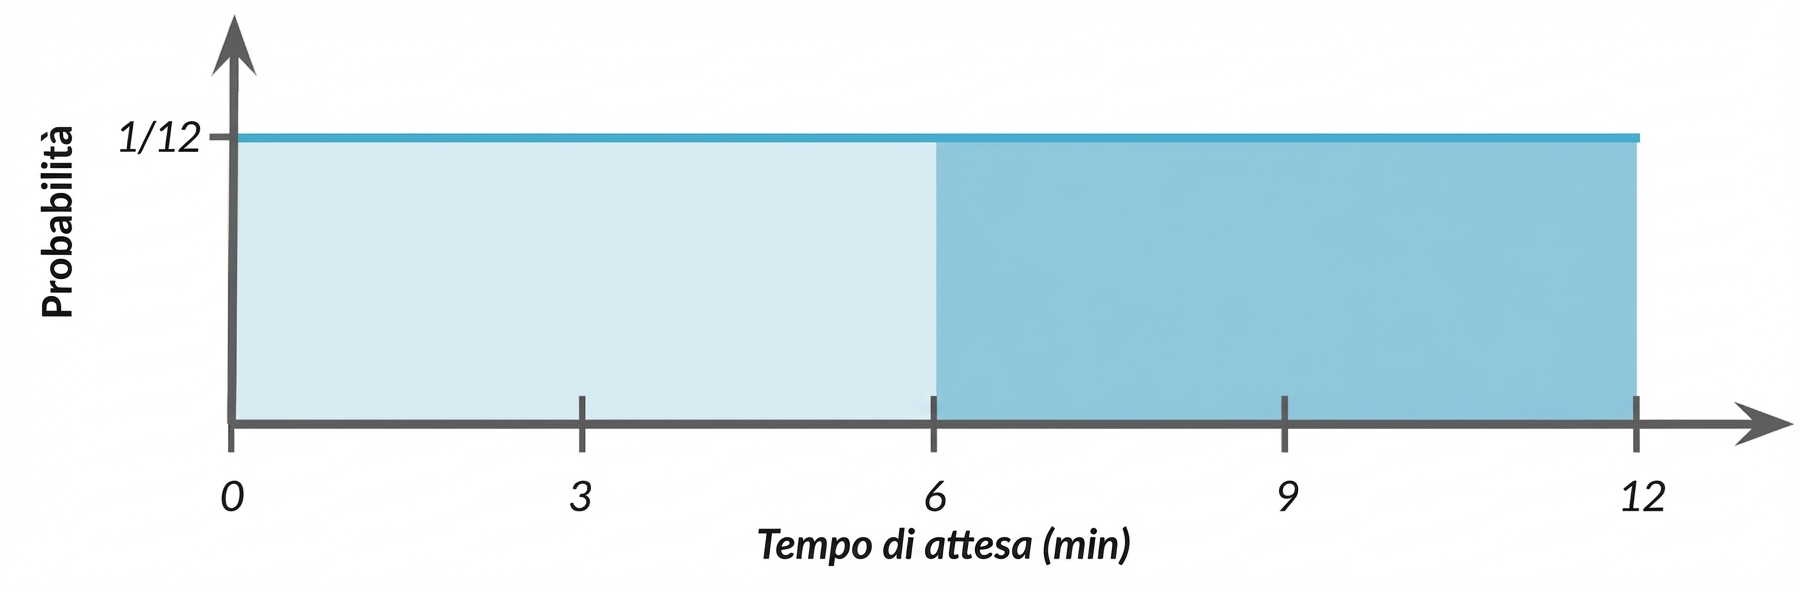
Probabilità = area (ancora)
$$P(4 \le \text{wait time} \le 7) = 3 \times 1/12 = 3/12$$
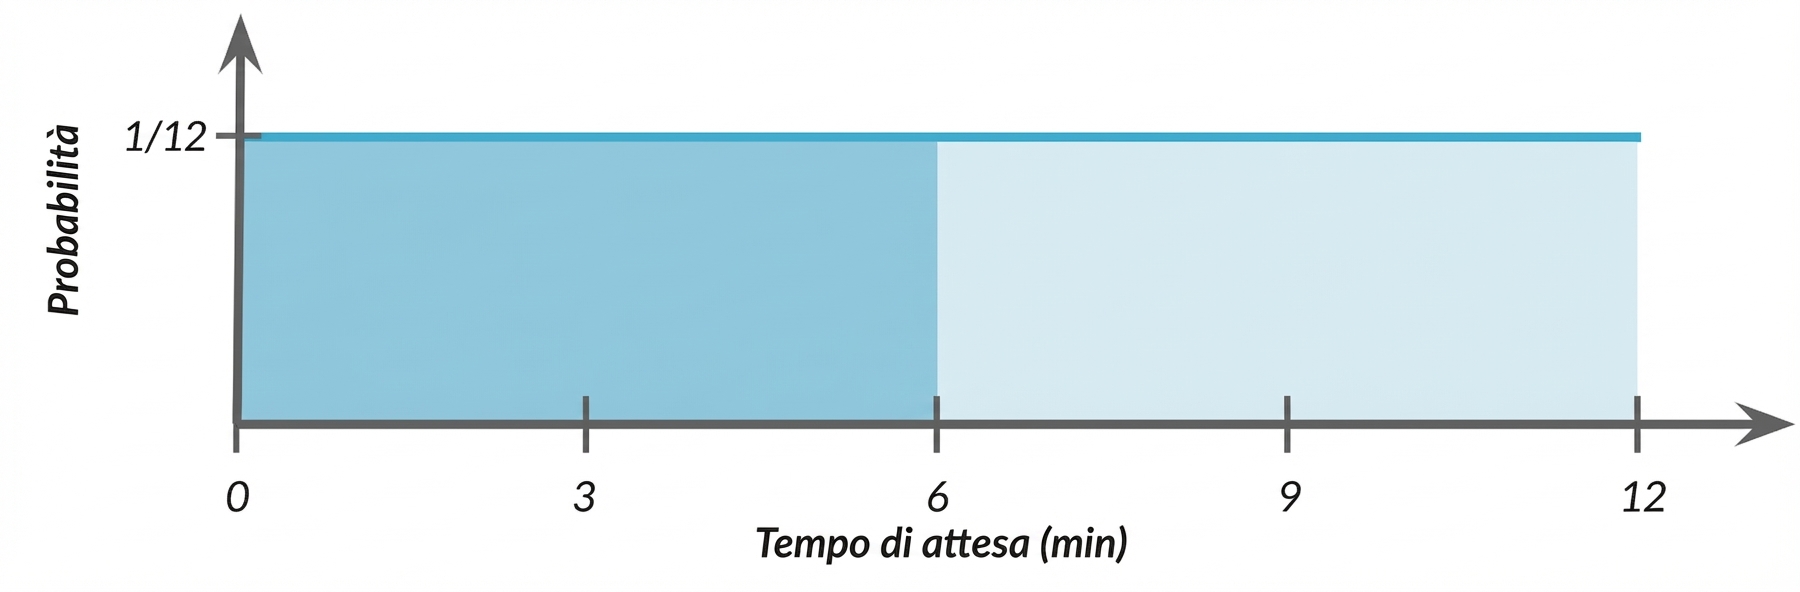
Attesa di sette minuti o meno
$$ P(\text{wait time} \le 7) = ~~ ?$$
$$ P(\text{wait time} \le 7) = \frac{7-0}{12} $$
$$ P(\text{wait time} \le 7) = \frac{7}{12} = 58.33\% $$
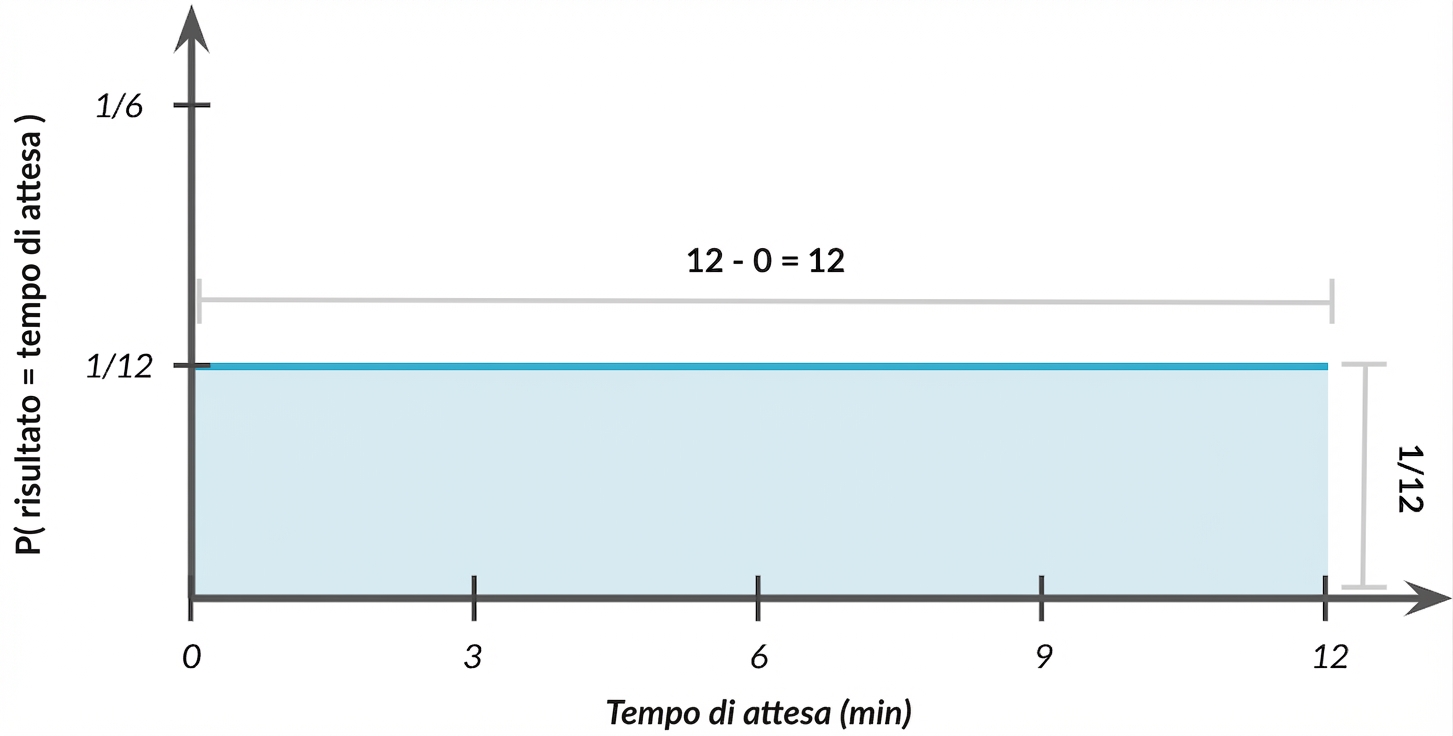
Area totale = 1
$$P(0 \le \text{wait time} \le 12) = ~~ ?$$
Area totale = 1
$$P(0 \le \text{outcome} \le 12) = 12 \times 1/12 = 1$$
Probabilità di attendere più di sette minuti
$$ P(\text{wait time} \ge 7) = 1 - \frac{7}{12} $$
$$ P(\text{wait time} \ge 7) = \frac{5}{12} = 41.67\% $$
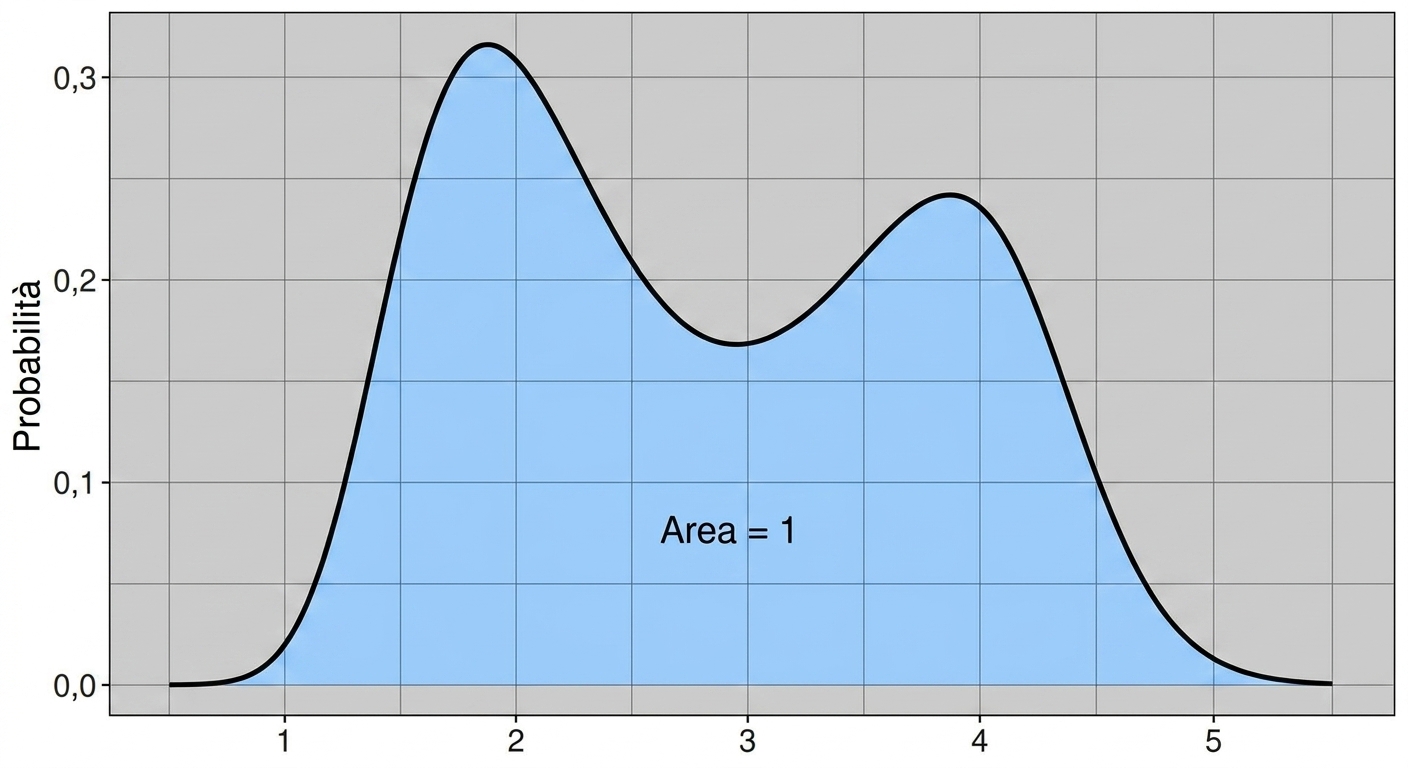
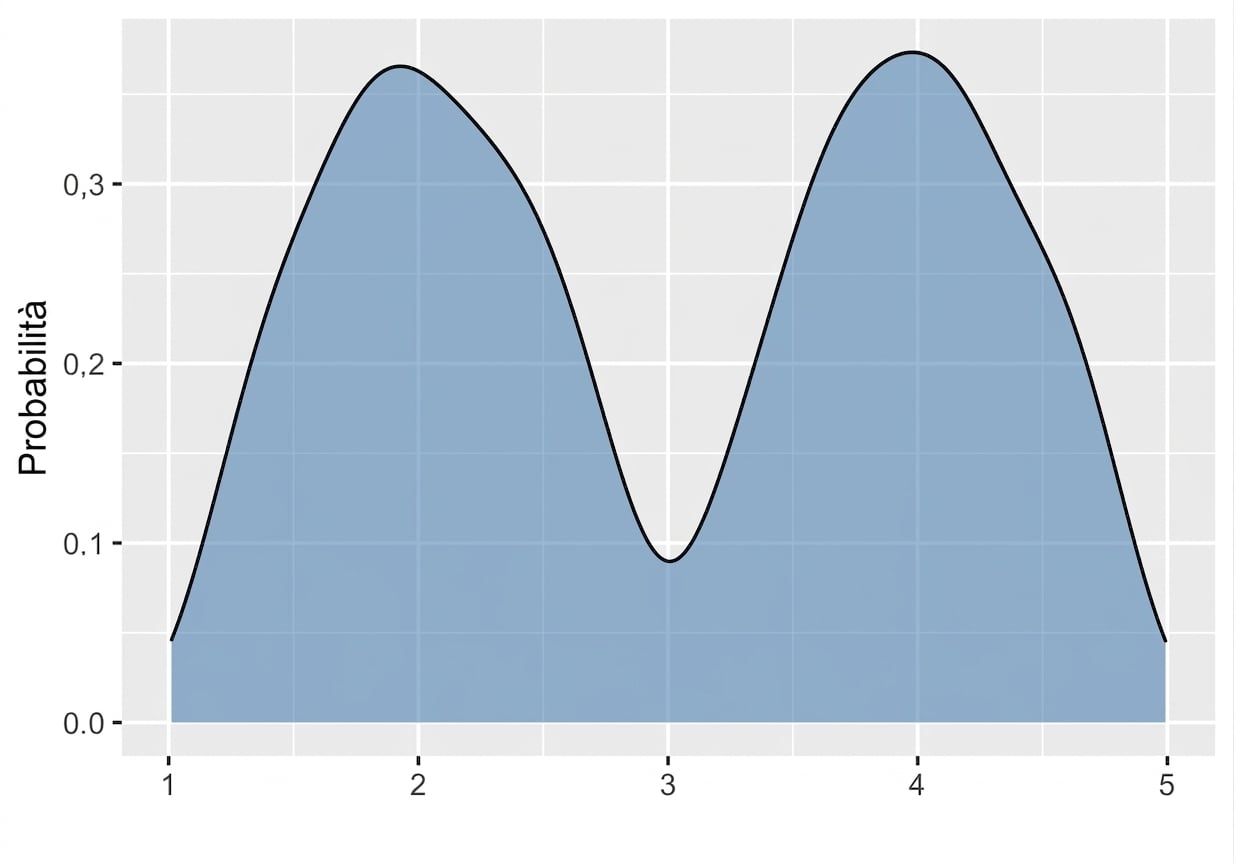
Distribuzione bimodale
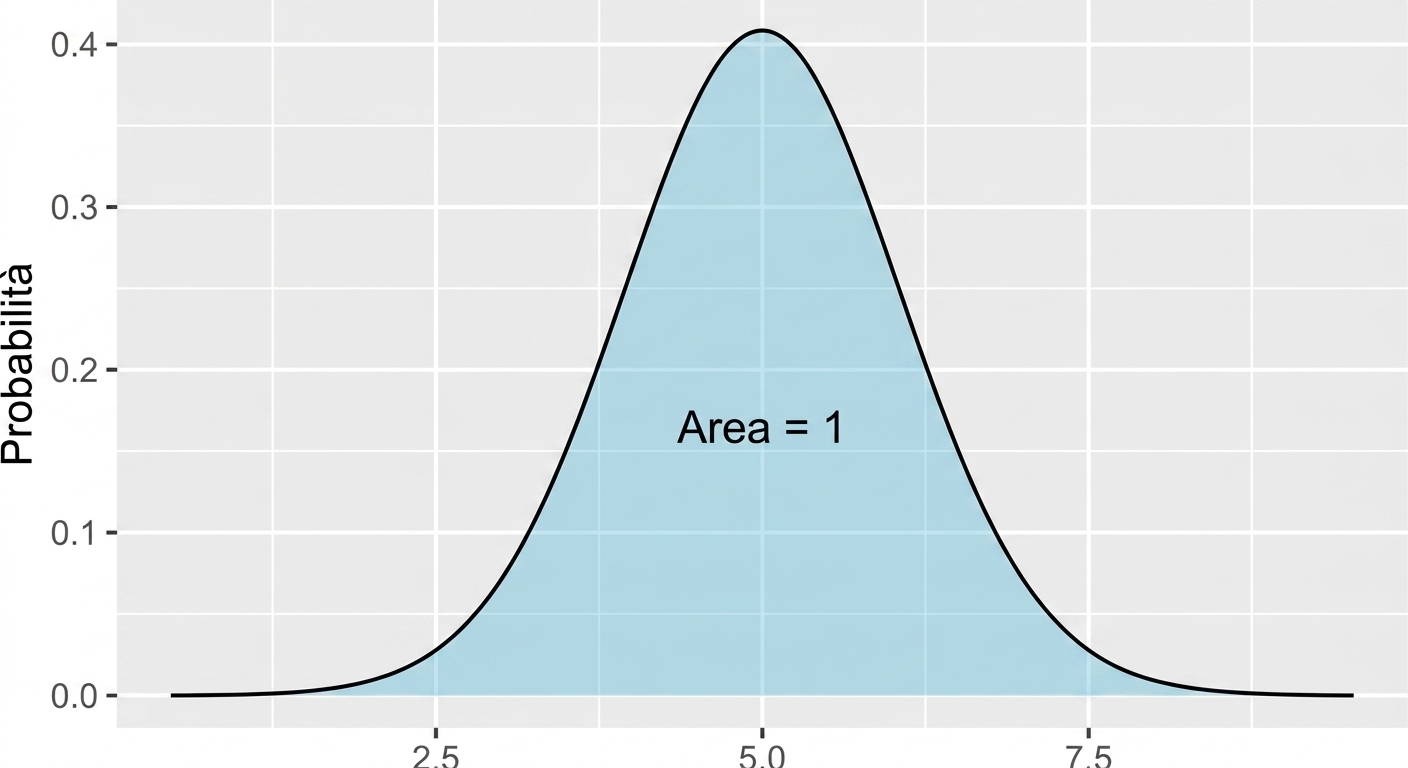
La distribuzione normale
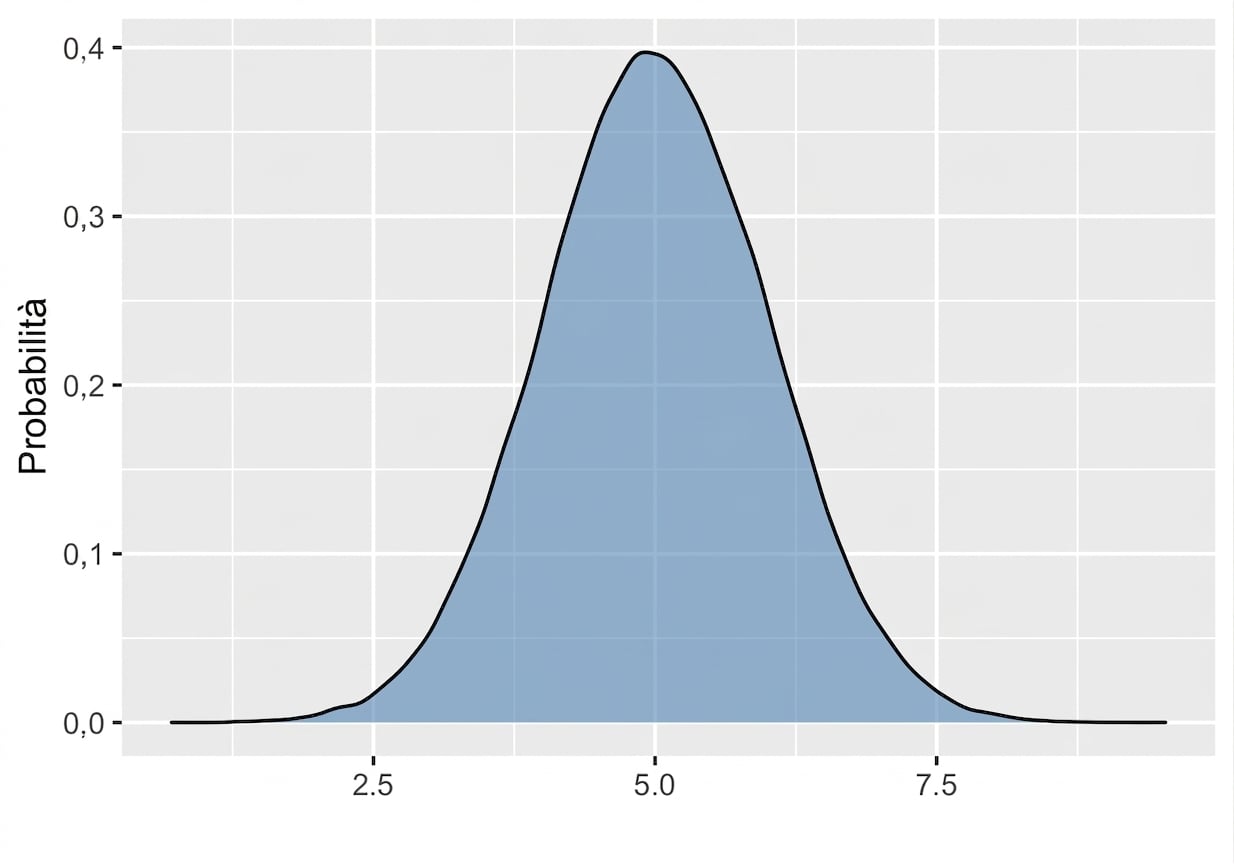
Area totale sempre = 1