Distribuzioni discrete
Introduzione alla statistica

George Boorman
Curriculum Manager, DataCamp
Lanciare i dadi
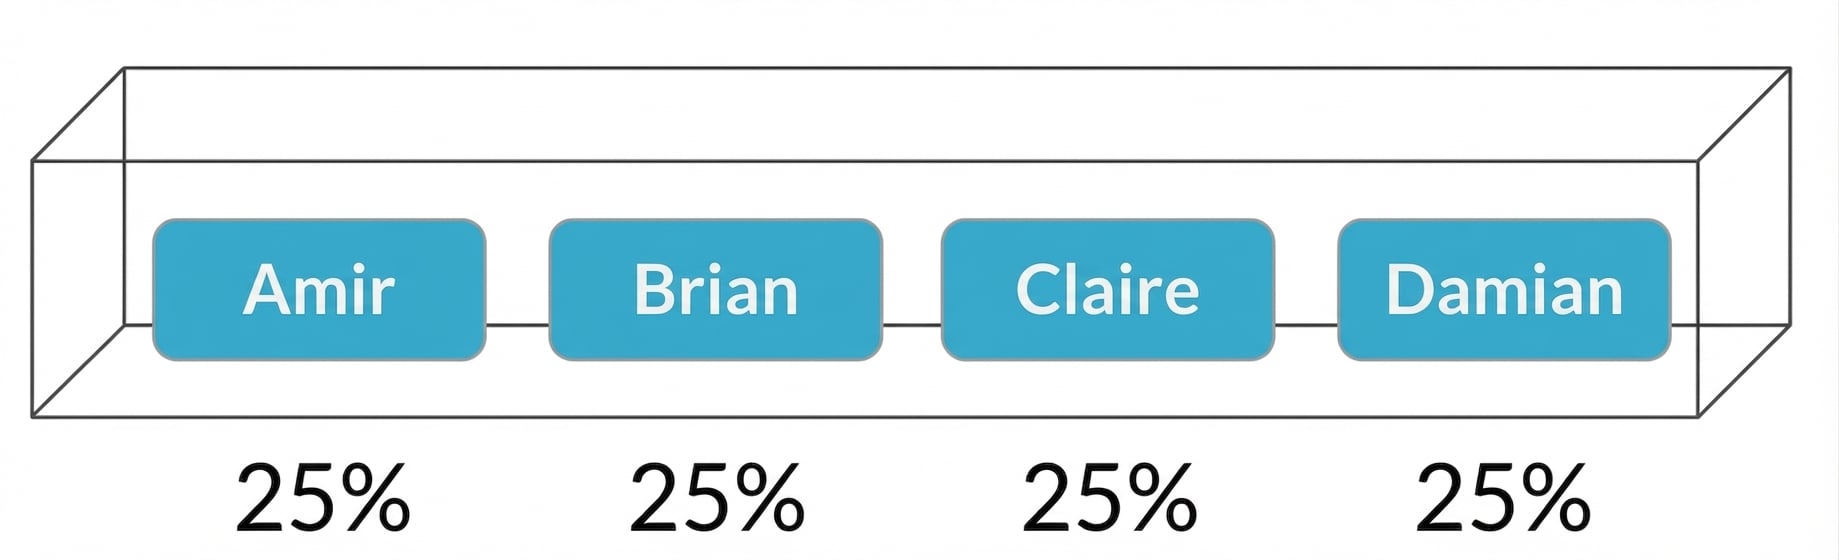
Scegliere i venditori
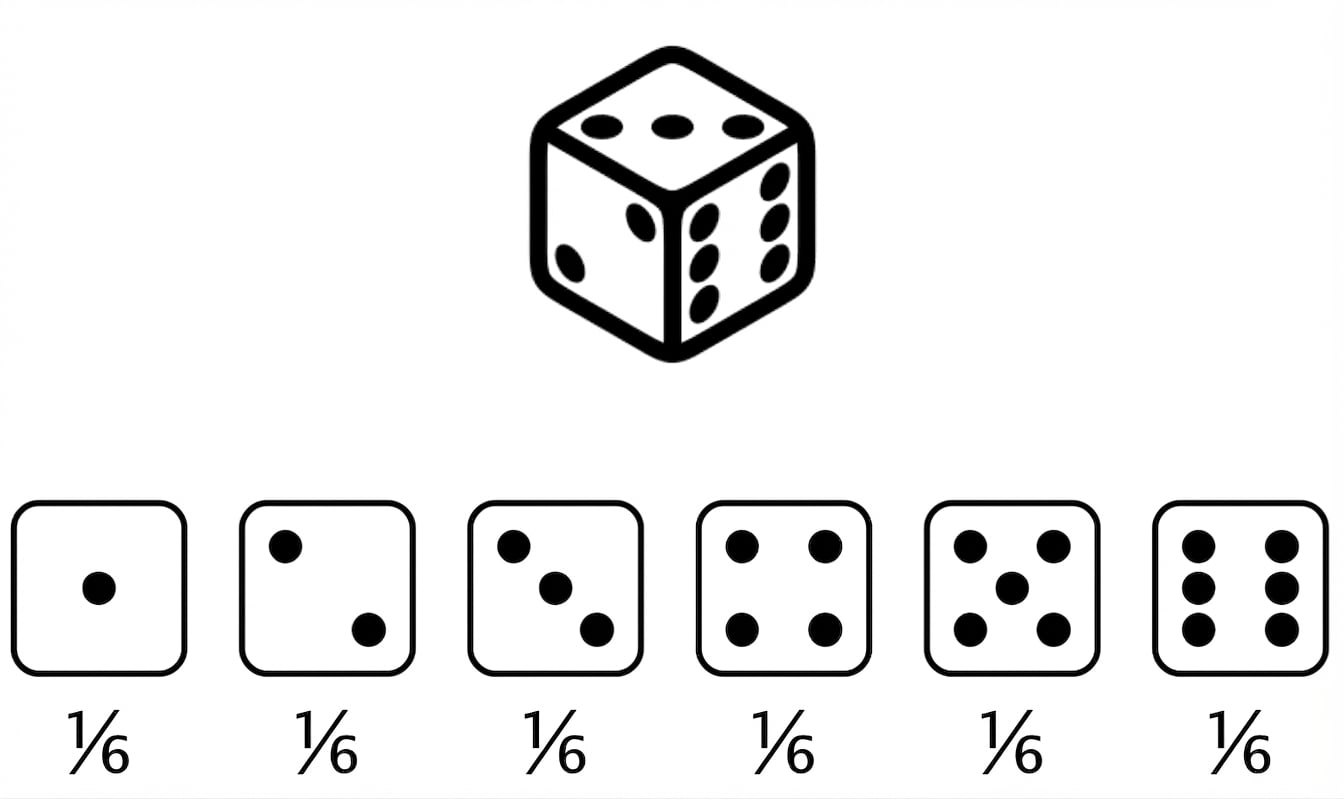
Distribuzione di probabilità
Descrive la probabilità di ogni possibile esito in uno scenario
Valore atteso: La media di una distribuzione di probabilità
Valore atteso di un dado equo = $(1 \times \frac{1}{6}) + (2 \times \frac{1}{6}) +(3 \times \frac{1}{6}) +(4 \times \frac{1}{6}) +(5 \times \frac{1}{6}) +(6 \times \frac{1}{6}) = 3{,}5$
Perché le distribuzioni di probabilità sono importanti?

Visualizzare una distribuzione di probabilità
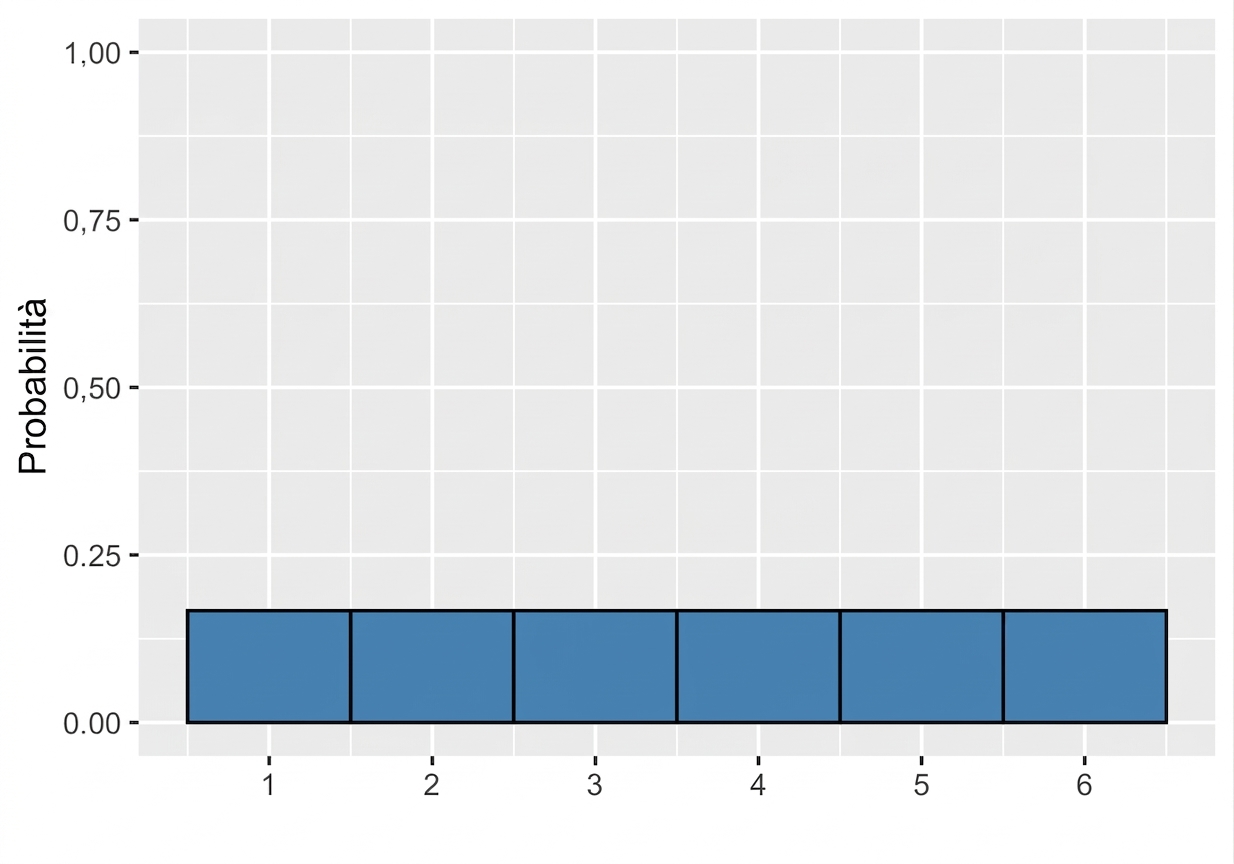
Probabilità = area
$$P(\text{lancio del dado}) \le 2 = ~?$$
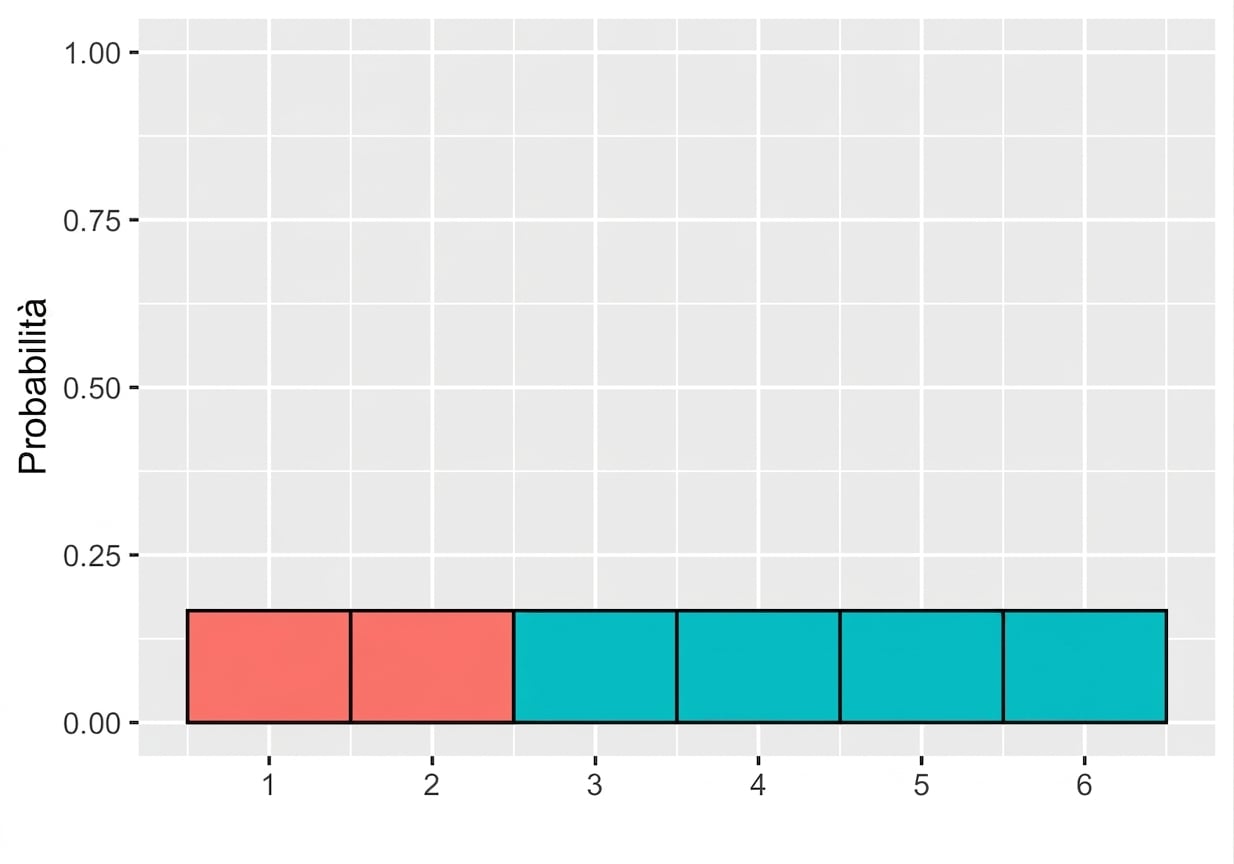
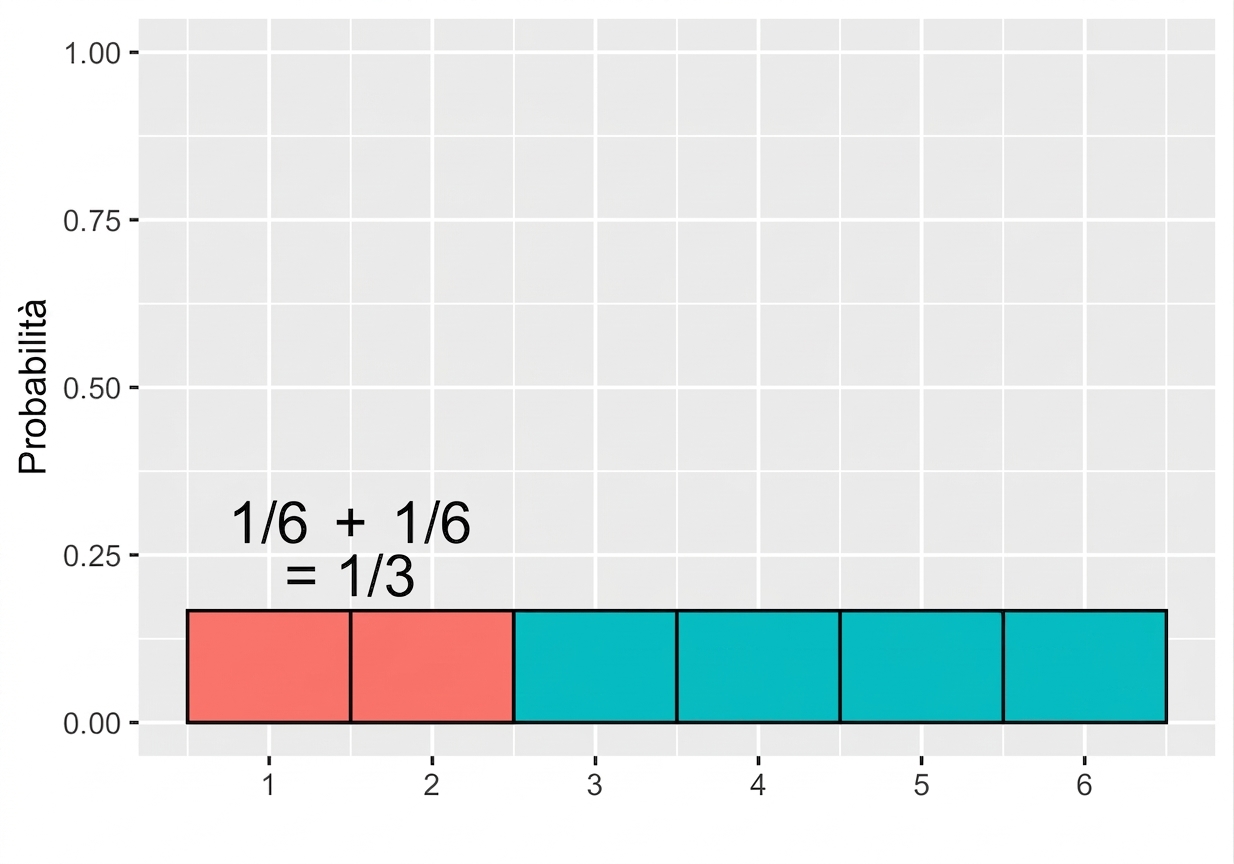
Probabilità = area
$$P(\text{lancio del dado}) \le 2 = 1/3$$
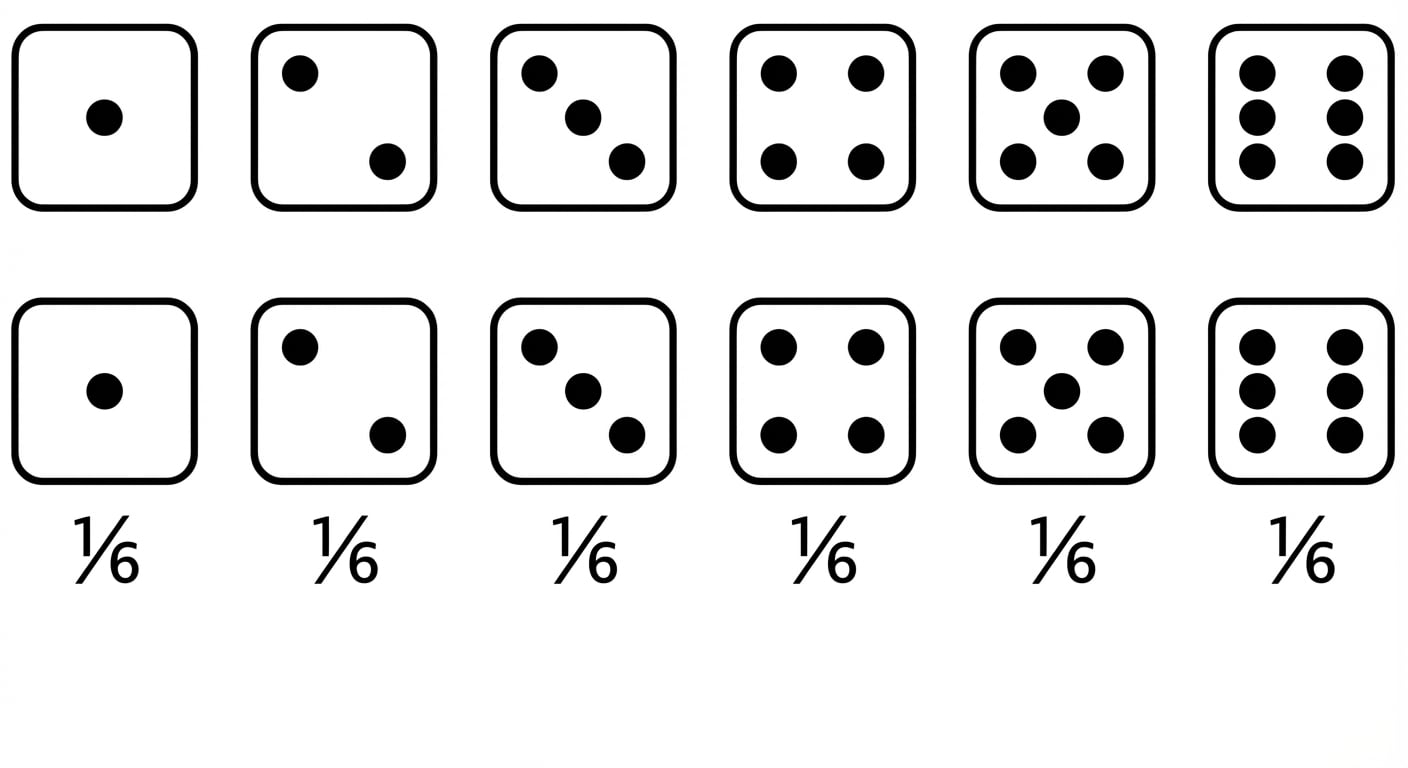
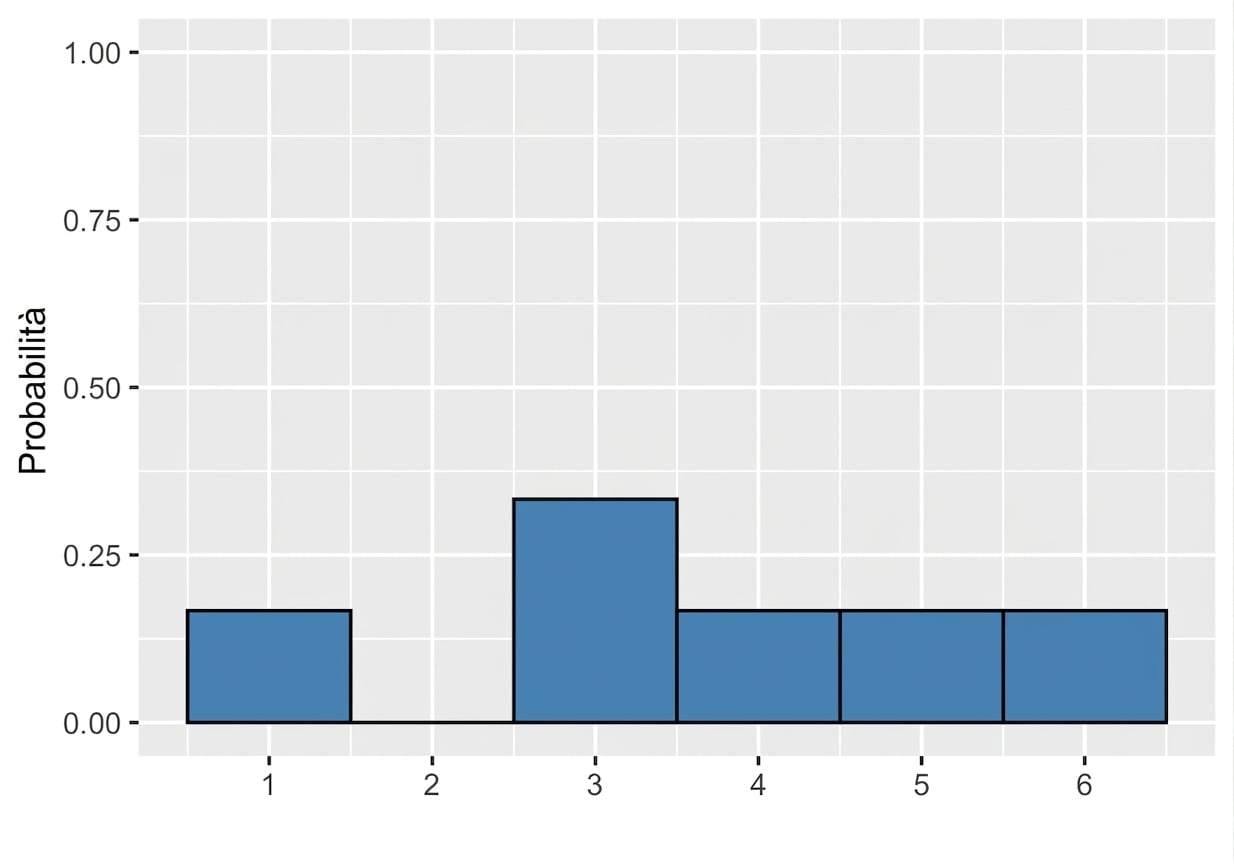
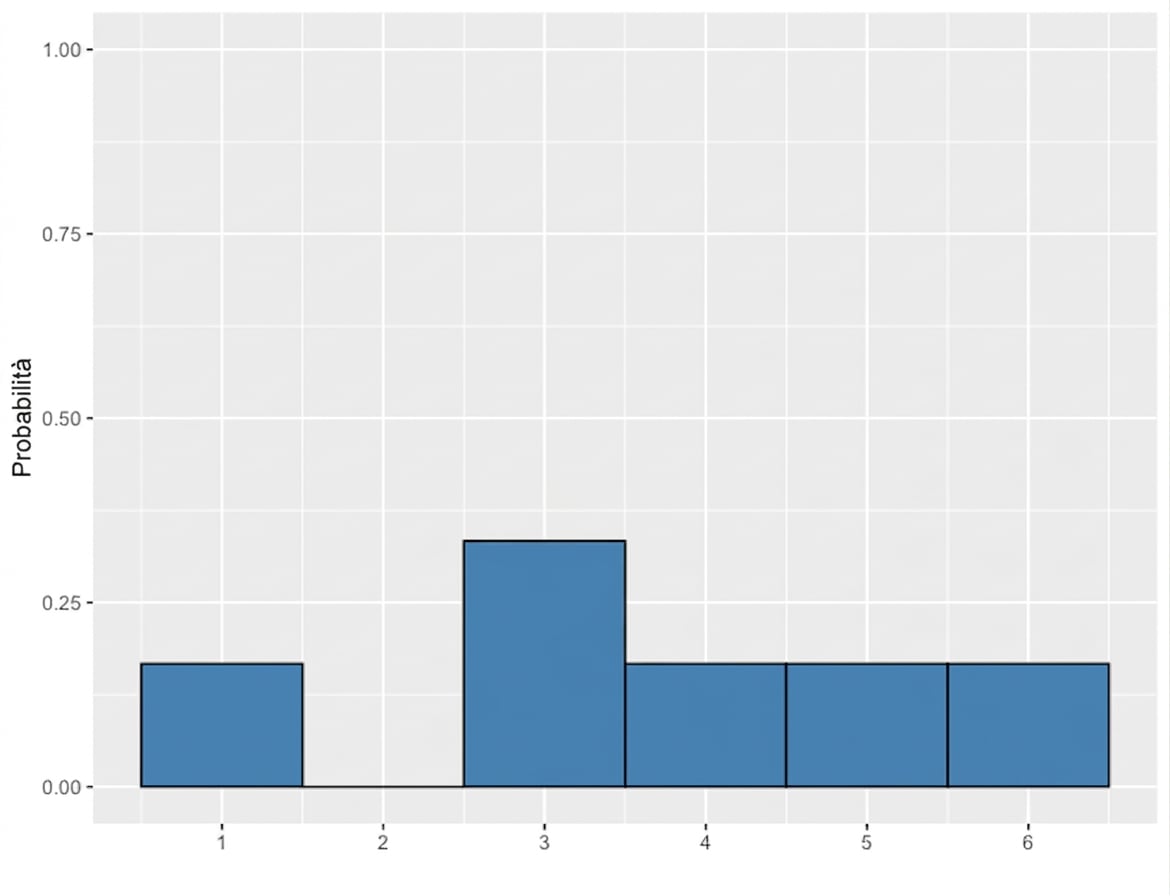
Dado sbilanciato
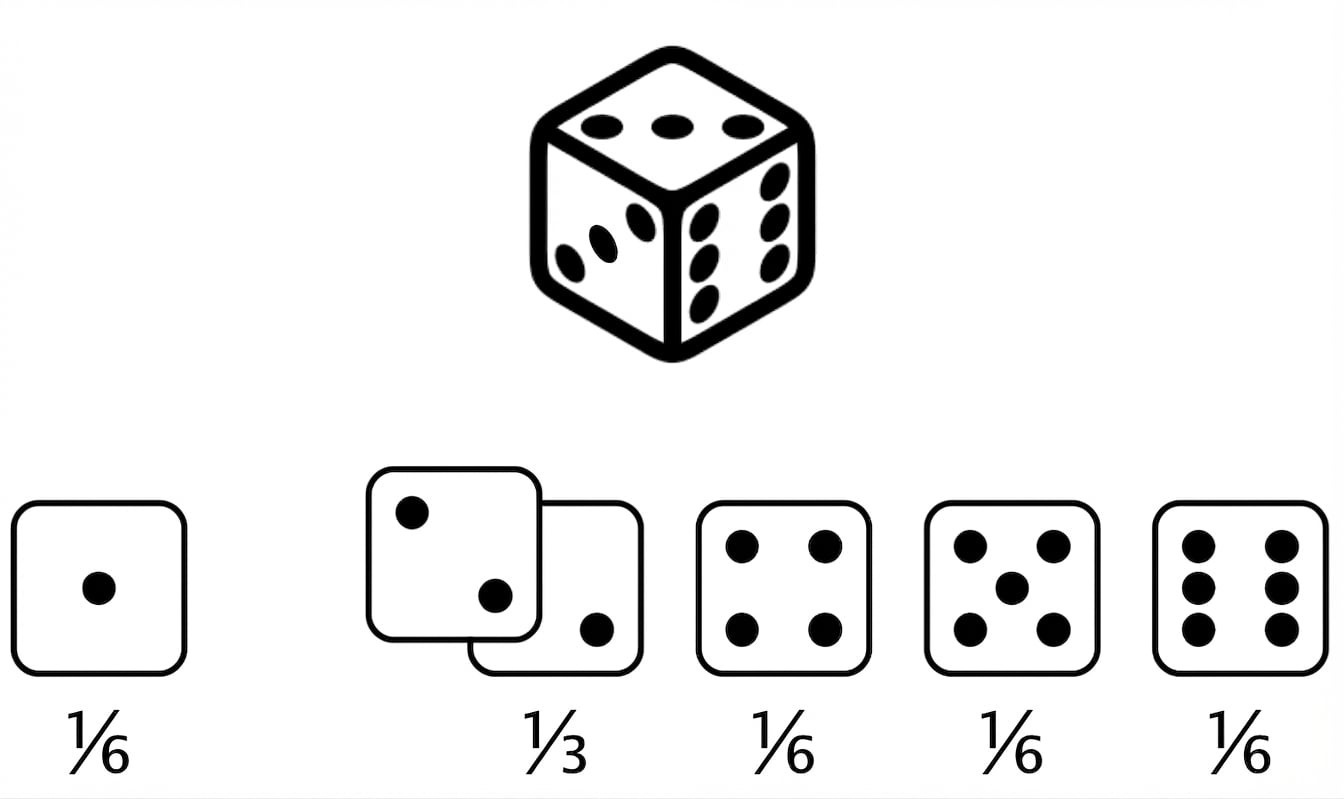
Valore atteso di un dado sbilanciato = $(1 \times \frac{1}{6}) +(2 \times 0) +(3 \times \frac{1}{3}) +(4 \times \frac{1}{6}) +(5 \times \frac{1}{6}) +(6 \times \frac{1}{6}) = 3{,}67$
Visualizzare probabilità sbilanciate
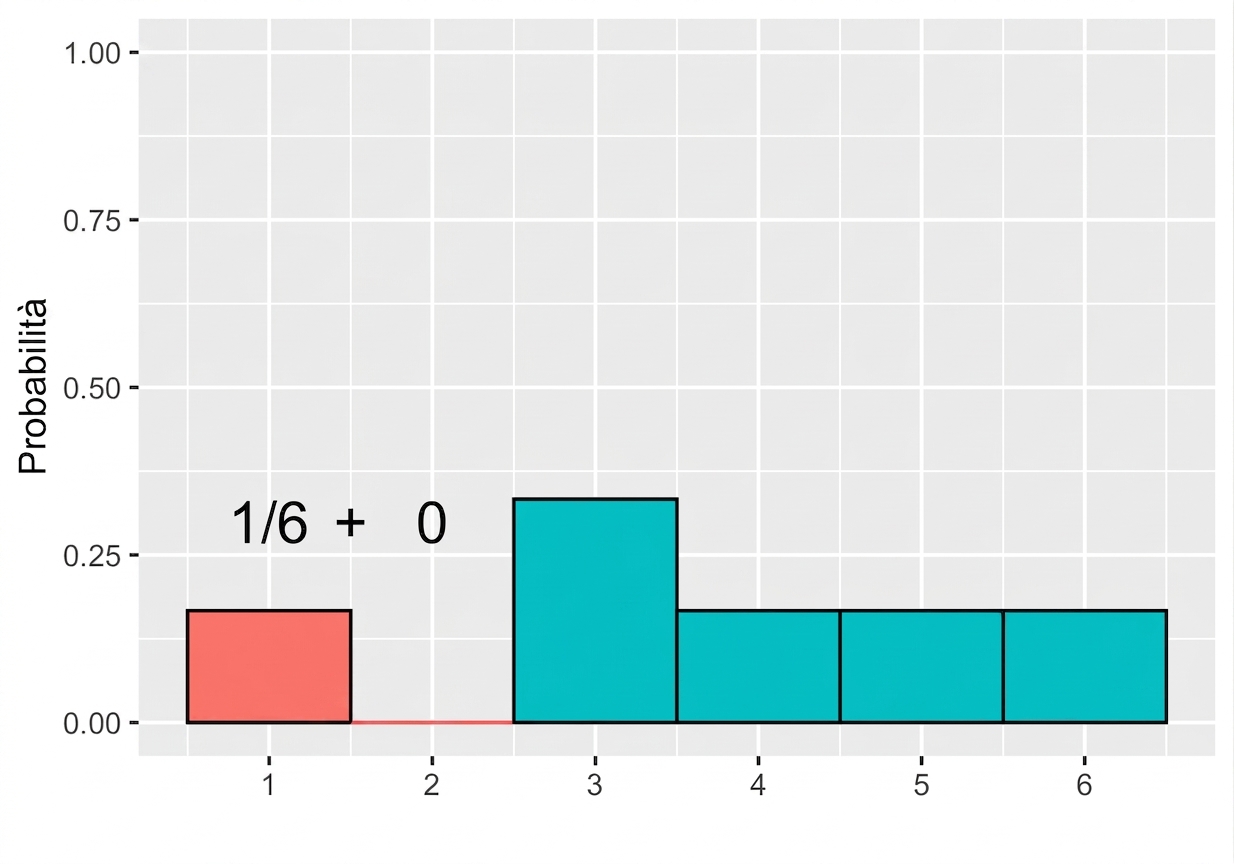
Sommare le aree
$$P(\text{lancio dado sbilanciato}) \le 2 = ~?$$
Sommare le aree
$$P(\text{lancio dado sbilanciato}) \le 2 = 1/6$$
Distribuzioni di probabilità discrete
Descrivi le probabilità per esiti discreti
Dado equo
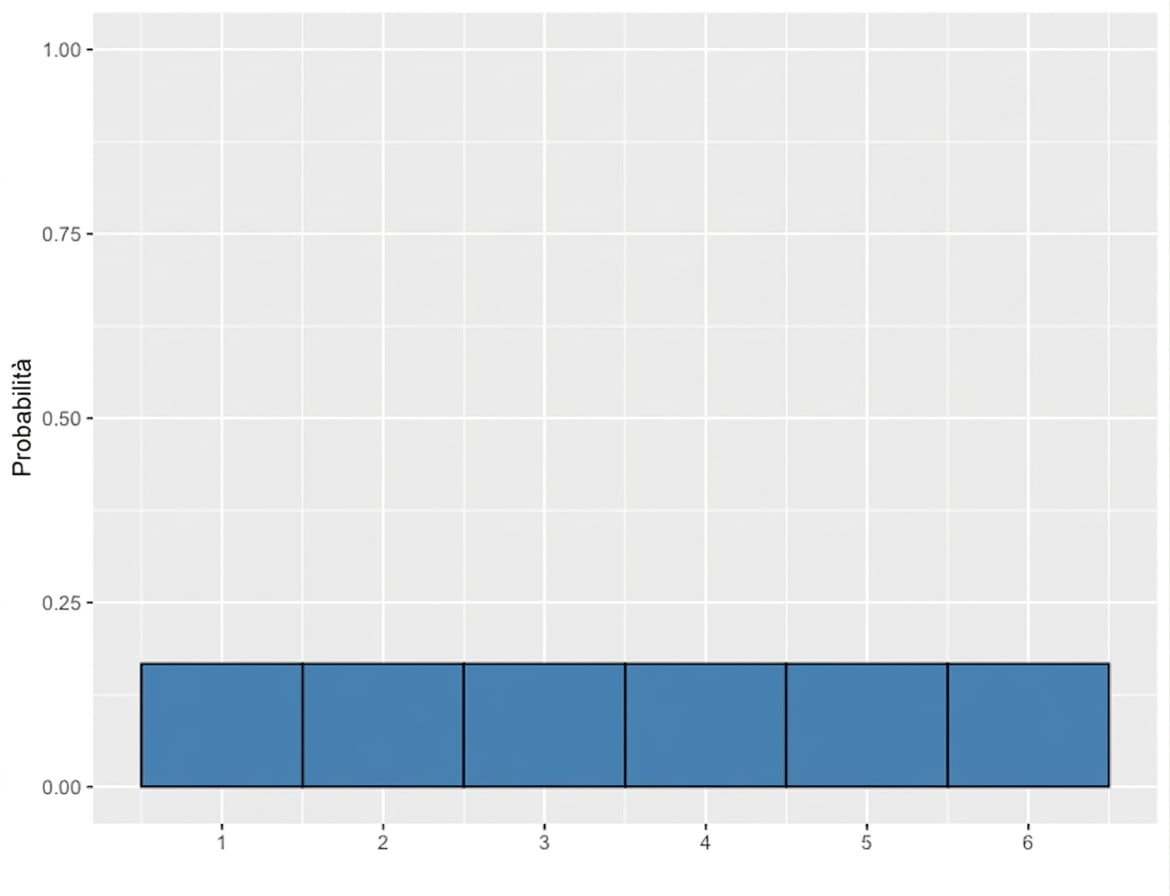
Distribuzione uniforme discreta
Dado sbilanciato
Visualizzare un campione
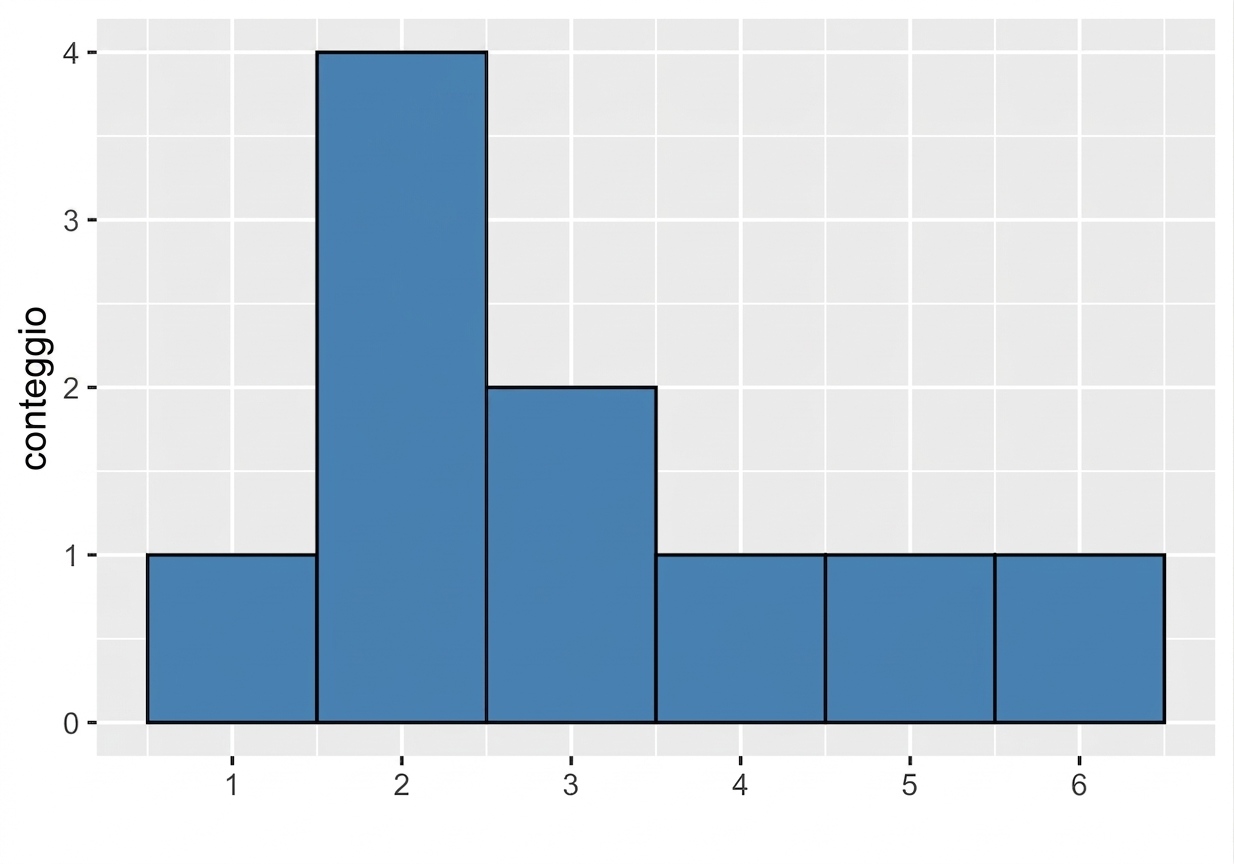
Distribuzione campionaria vs teorica
$ {Media} = 3{,}0 $
$ {Media} = 3{,}5 $
Un campione più grande
Campione di 100 lanci
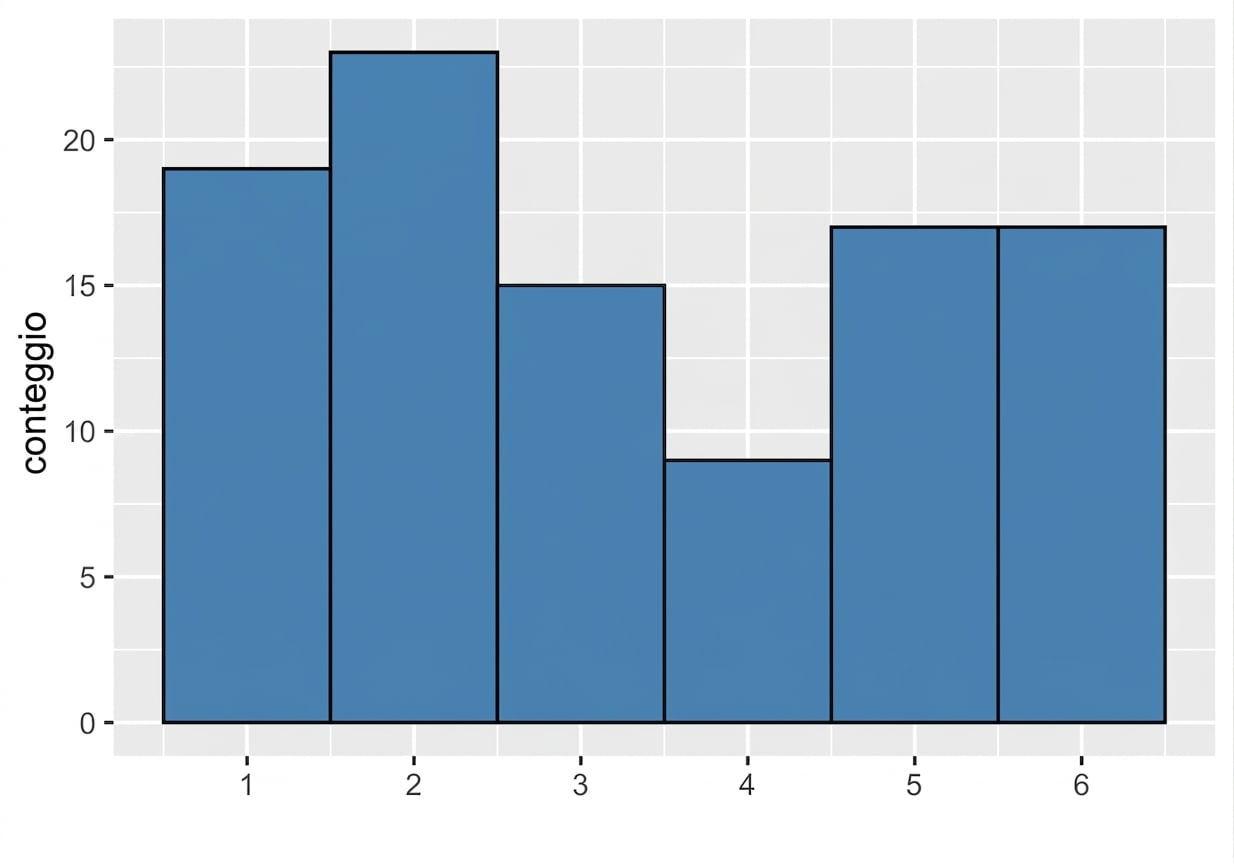
$ {Media} = 3{,}33 $
Un campione ancora più grande
Campione di 1000 lanci
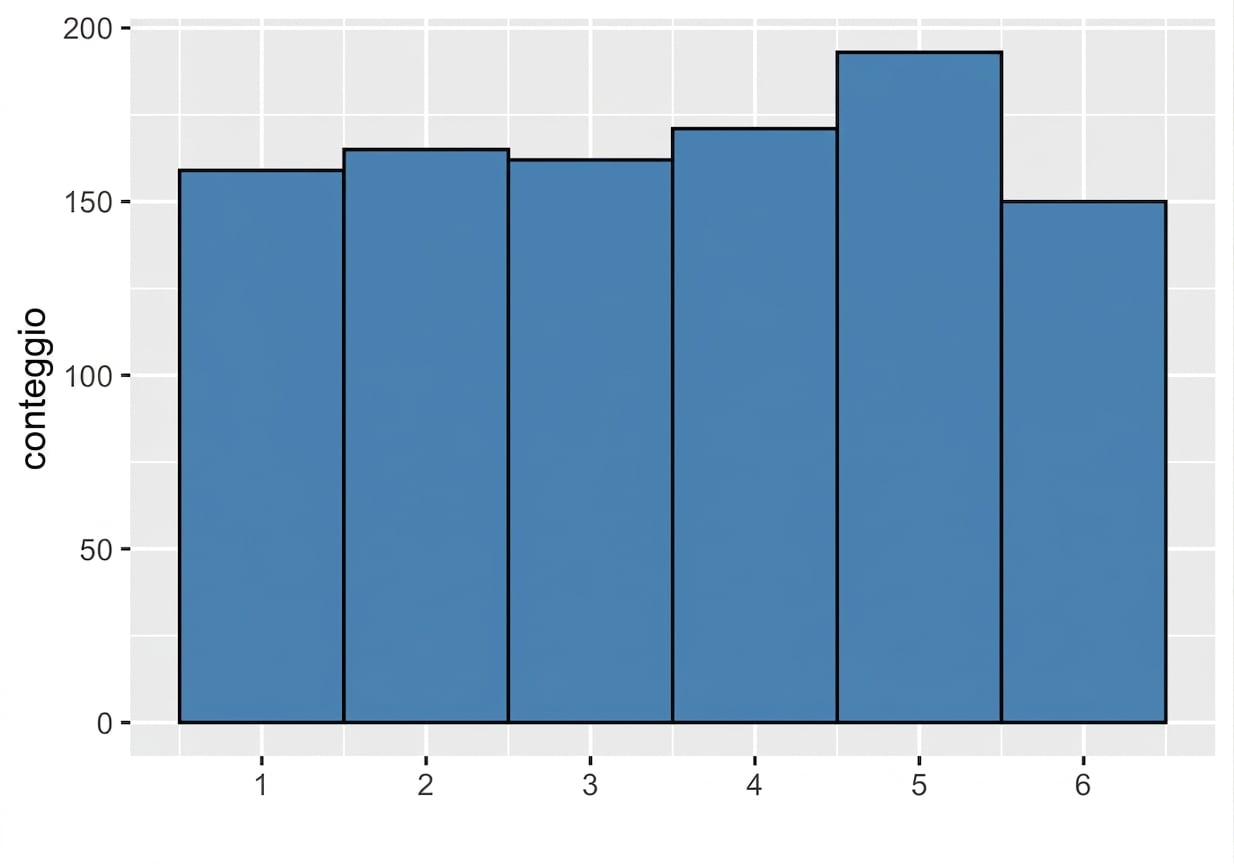
$ {Media} = 3{,}52 $

