Congratulazioni
Analisi esplorativa dei dati in Python

George Boorman
Curriculum Manager, DataCamp
Ispezione e validazione
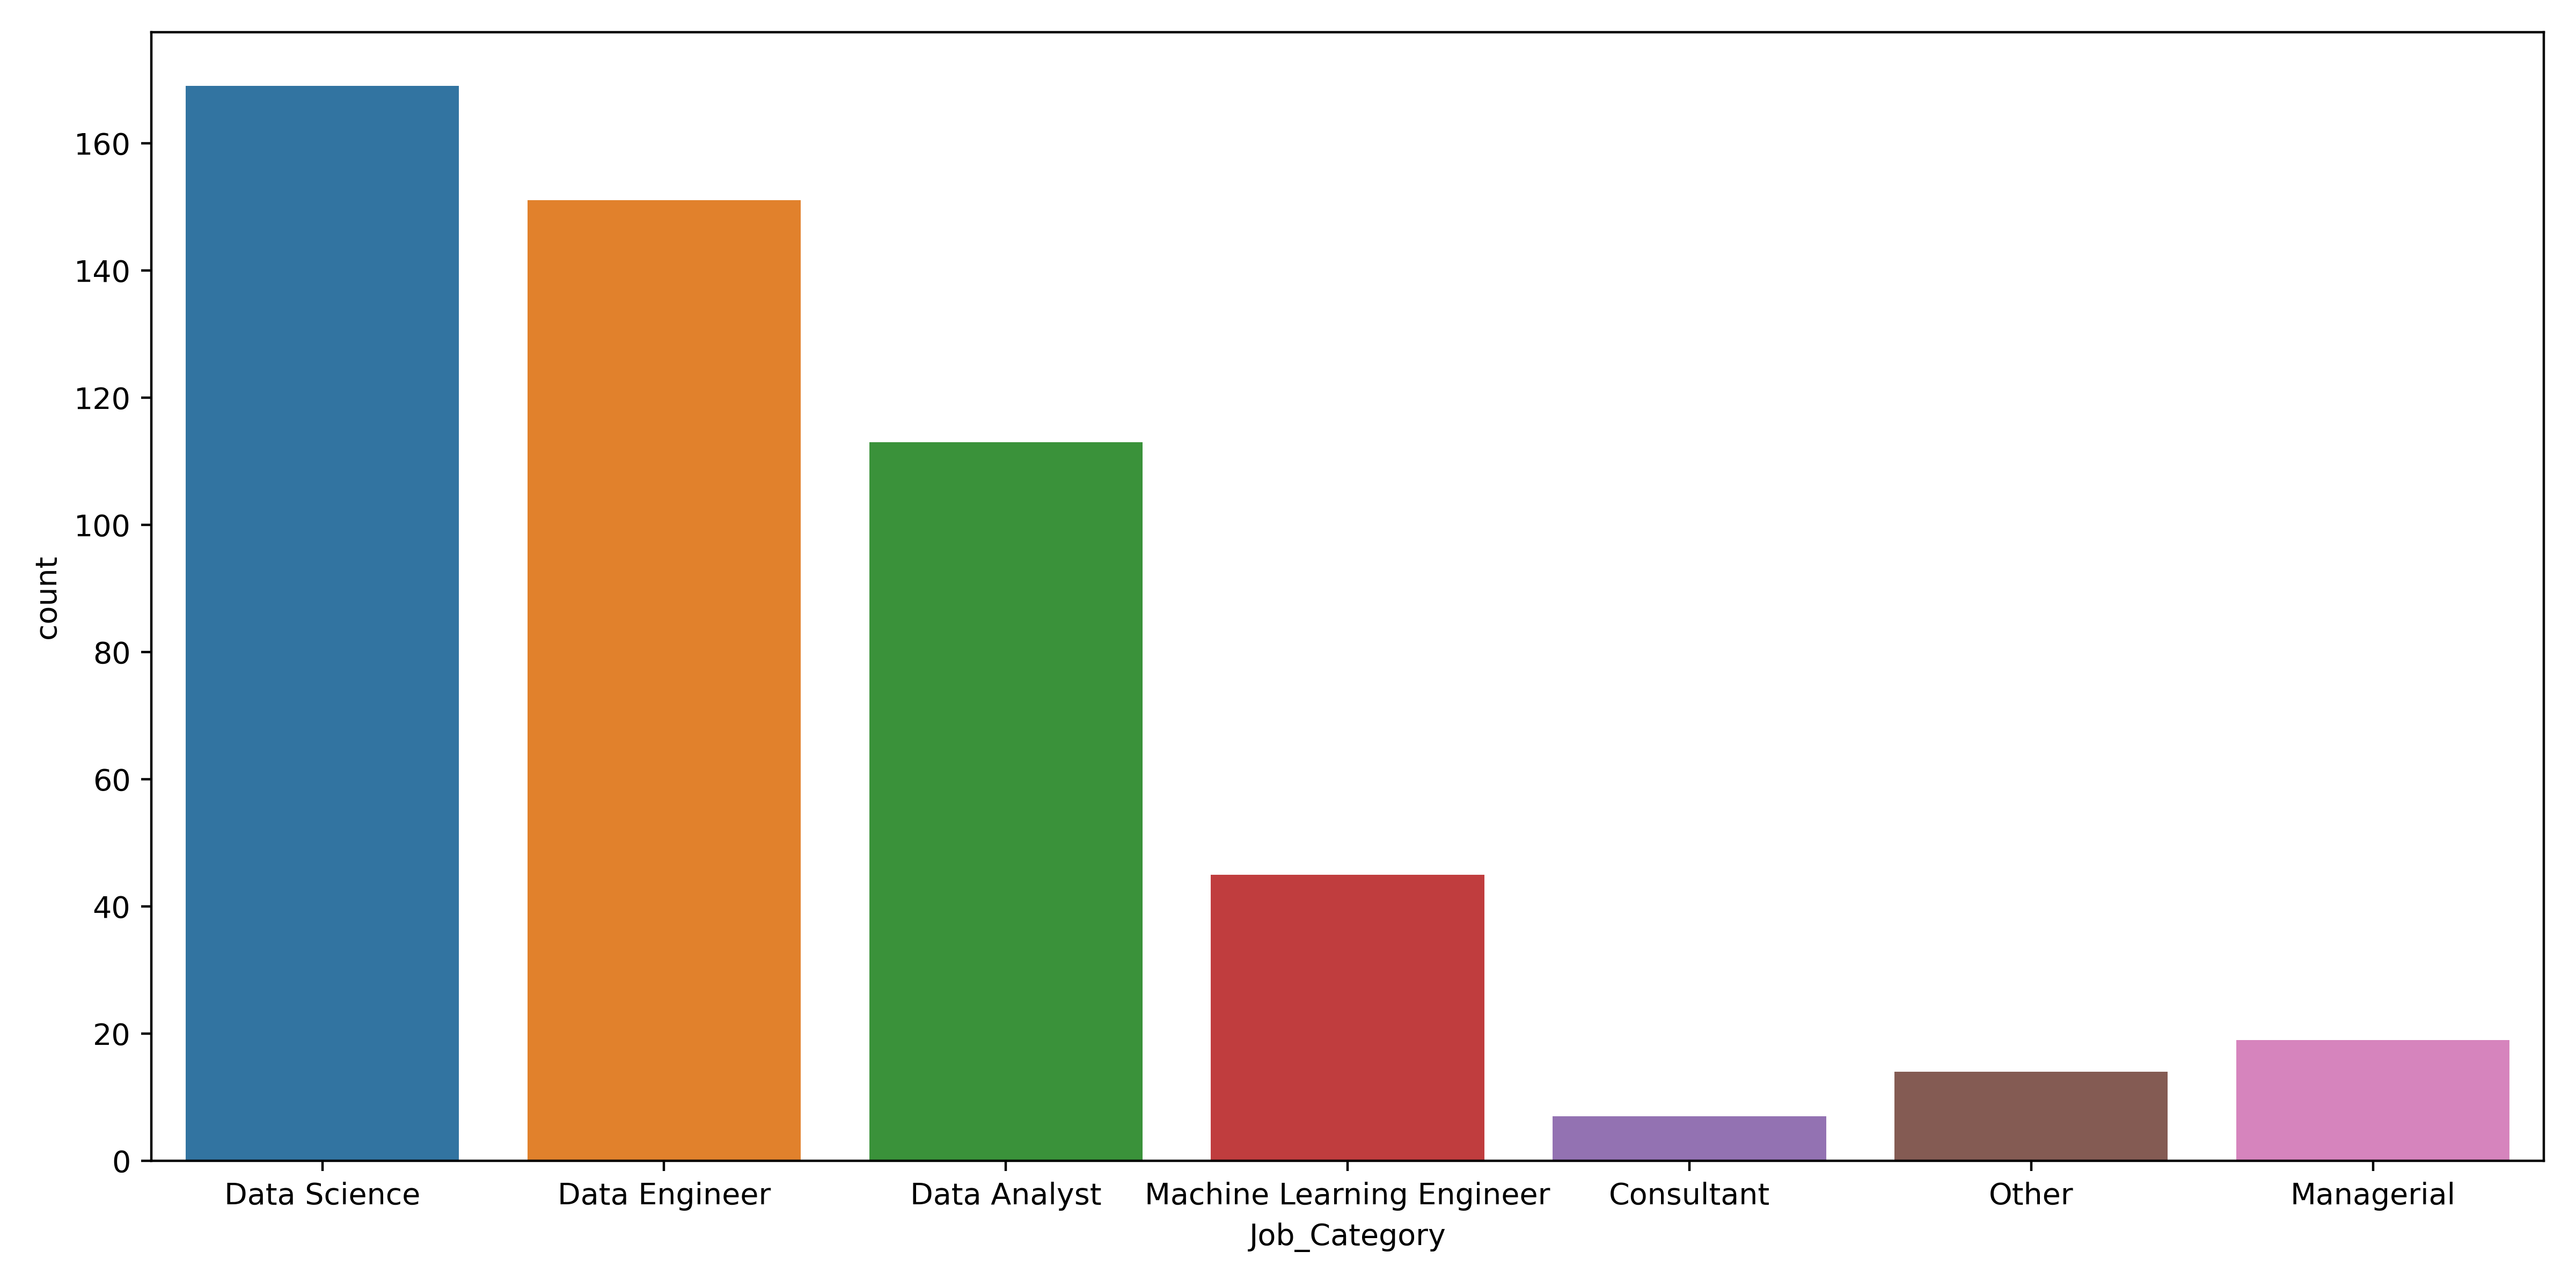
Analizza dati categorici
salaries["Job_Category"] = np.select(conditions,
                                     job_categories,
                                     default="Other")
Applica funzioni lambda
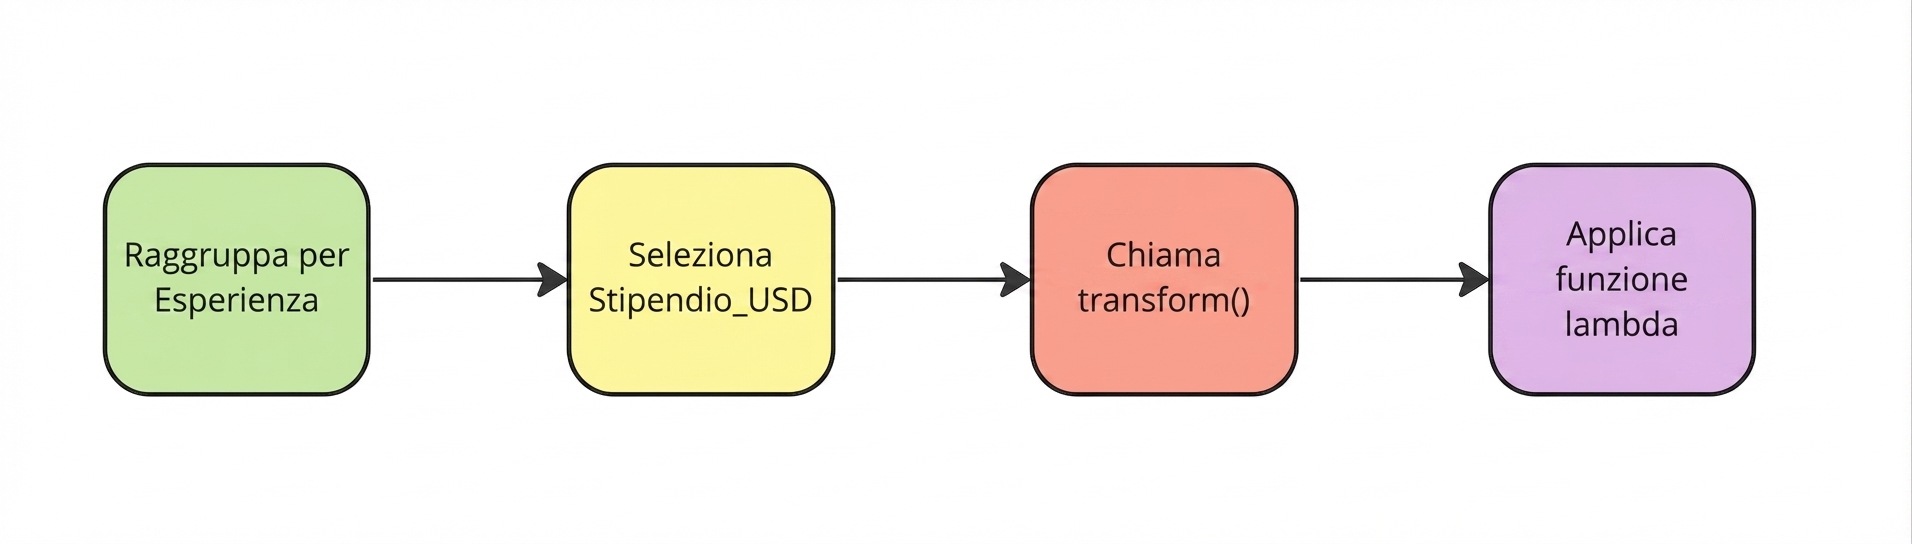
salaries["std_dev"] = salaries.groupby("Experience")["Salary_USD"].transform(lambda x: x.std())
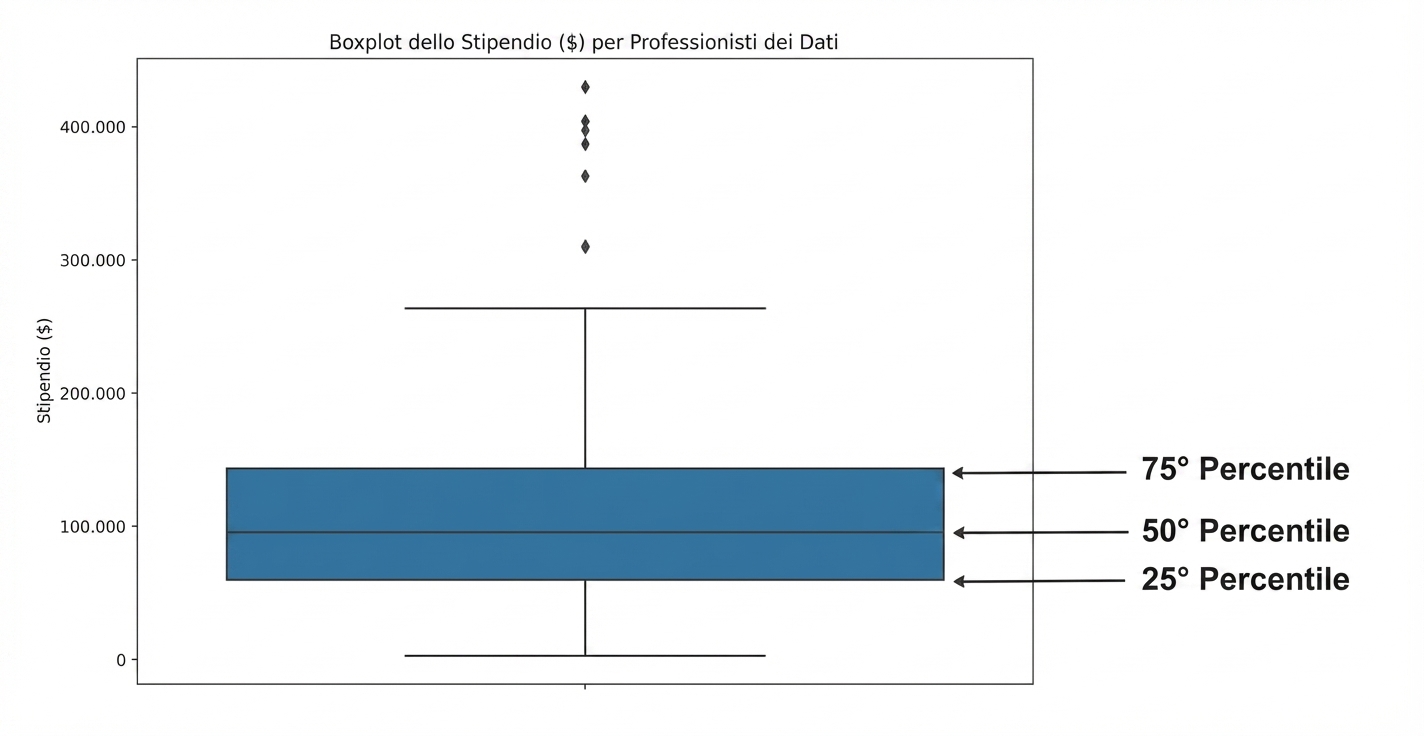
Gestisci gli outlier
sns.boxplot(data=salaries,
            y="Salary_USD")
plt.show()
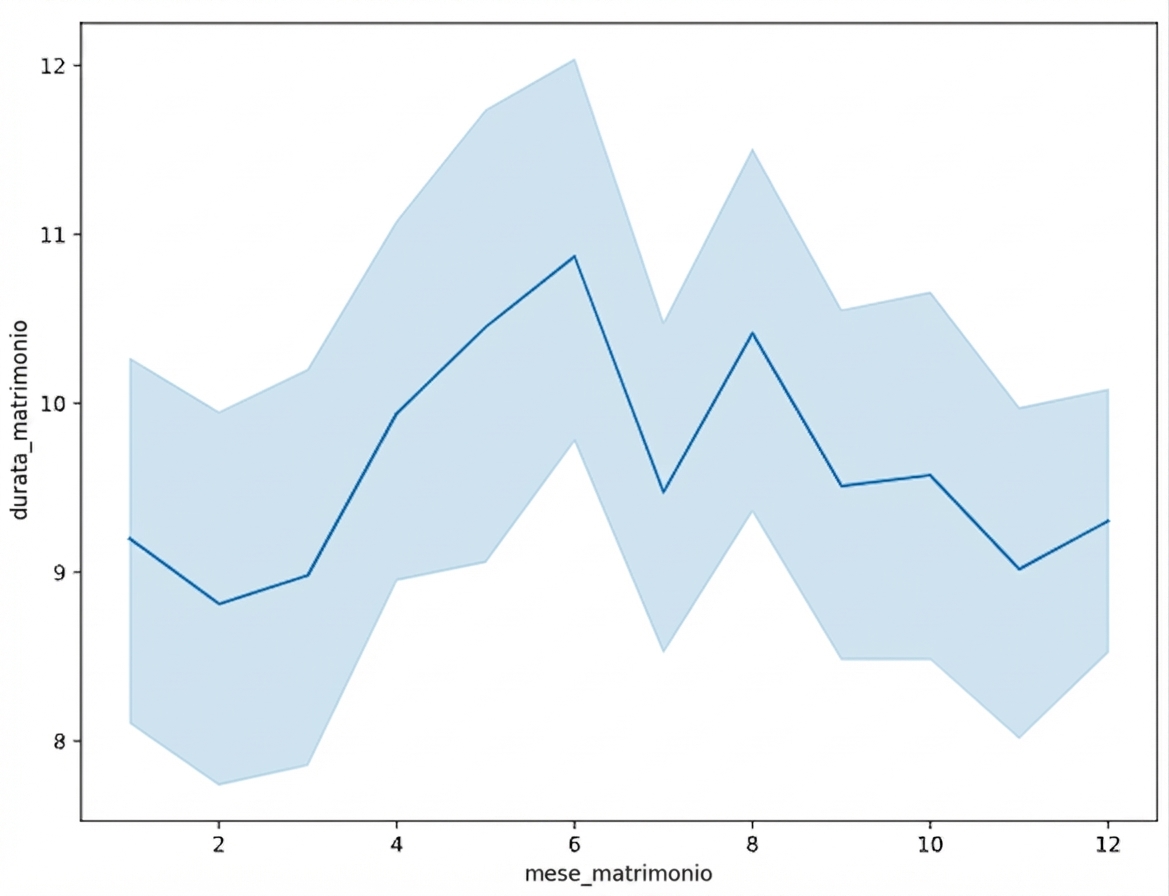
Pattern nel tempo
sns.lineplot(data=divorce, x="marriage_month", y="marriage_duration")
plt.show()
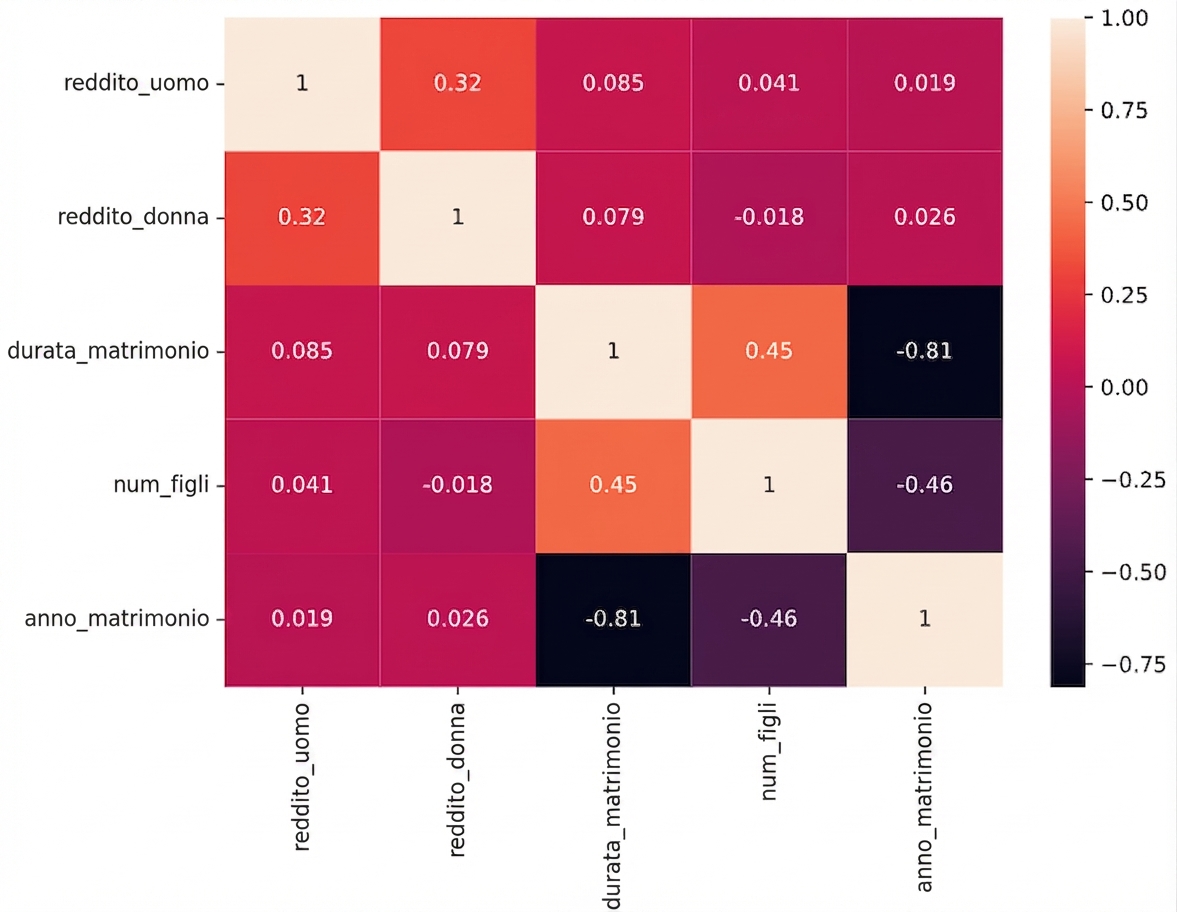
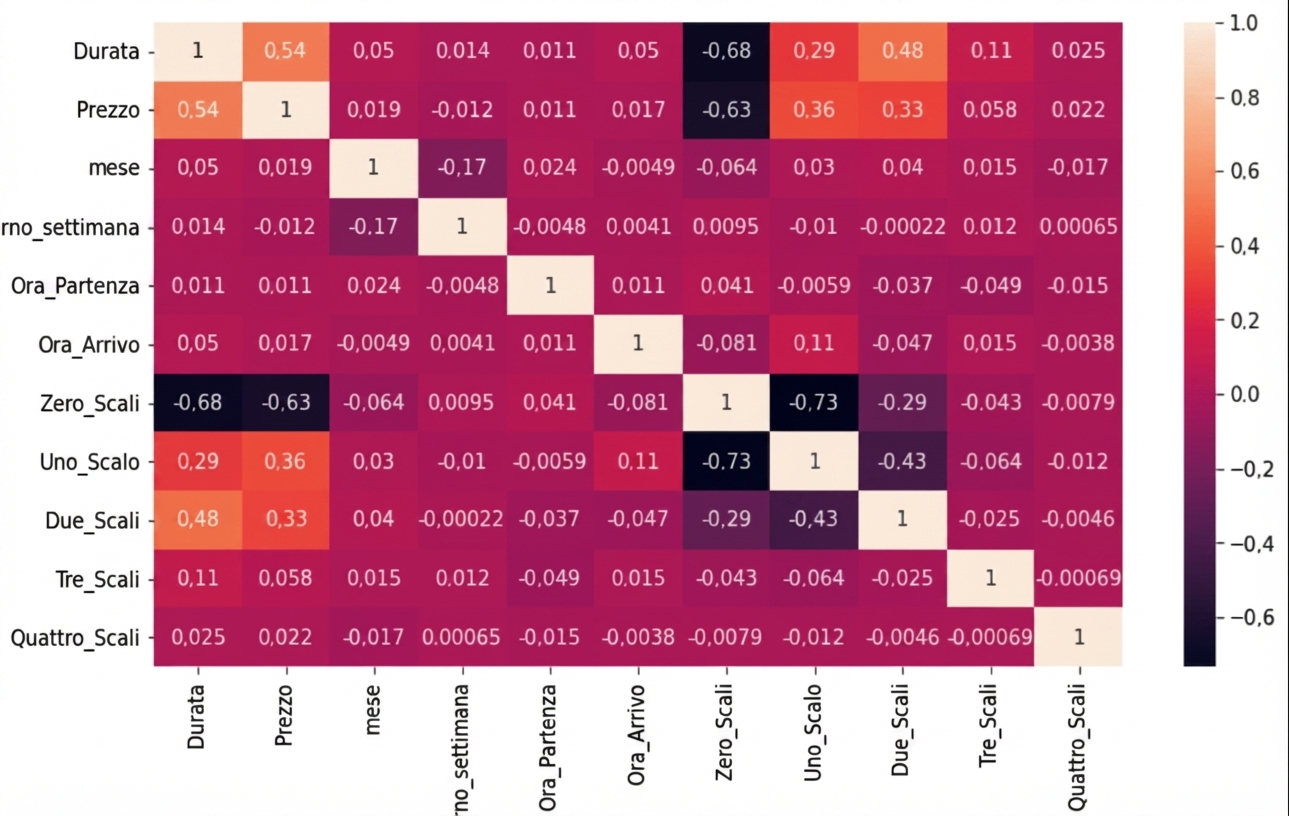
Correlazione
sns.heatmap(divorce.corr(numeric_only=True), annot=True)
plt.show()
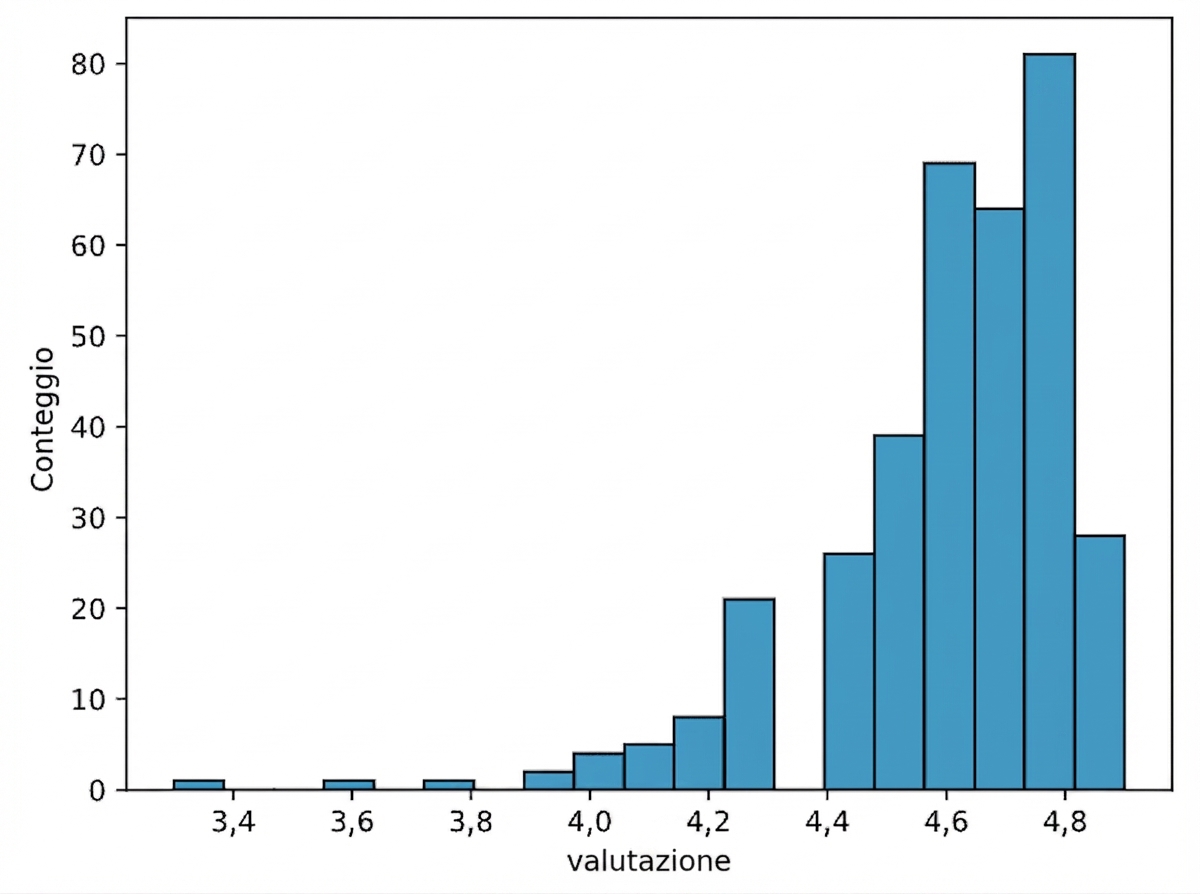
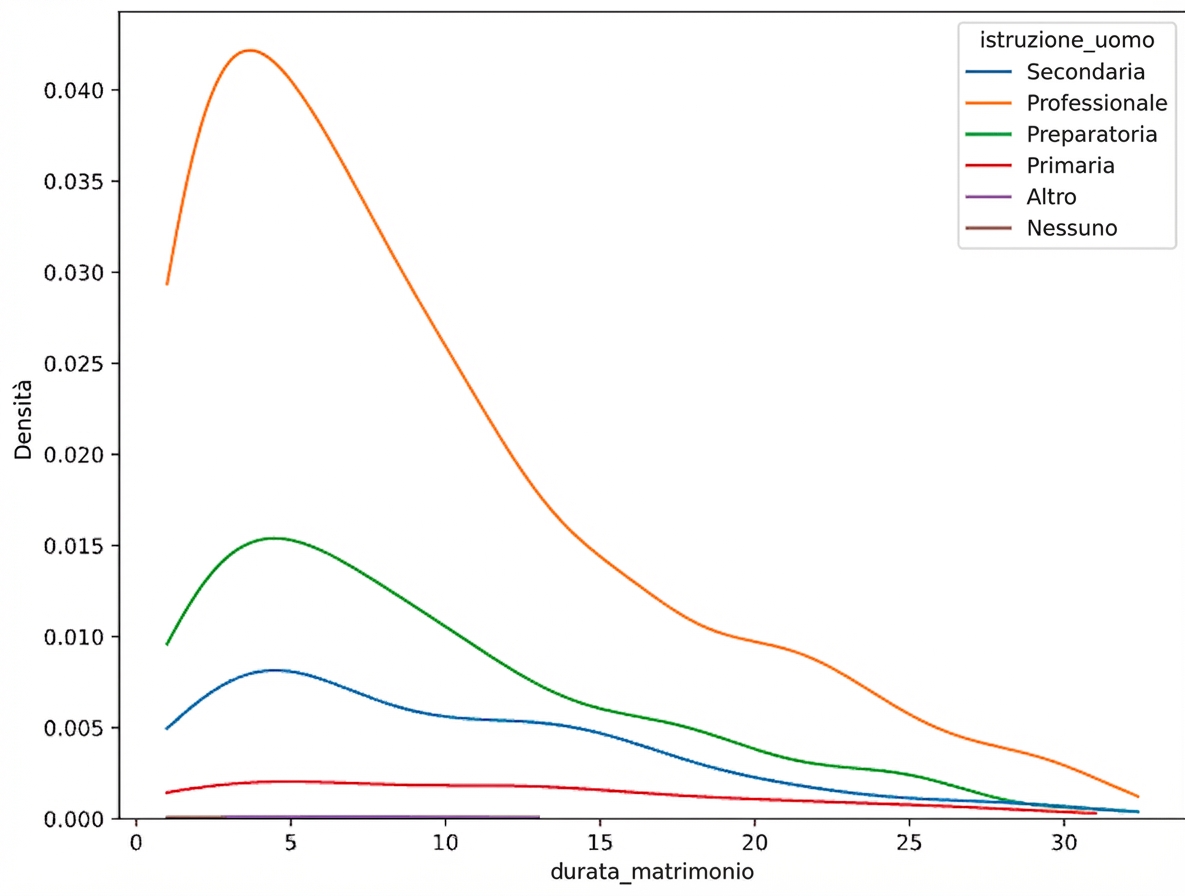
Distribuzioni
sns.kdeplot(data=divorce, x="marriage_duration", hue="education_man", cut=0)
plt.show()
pd.cut()
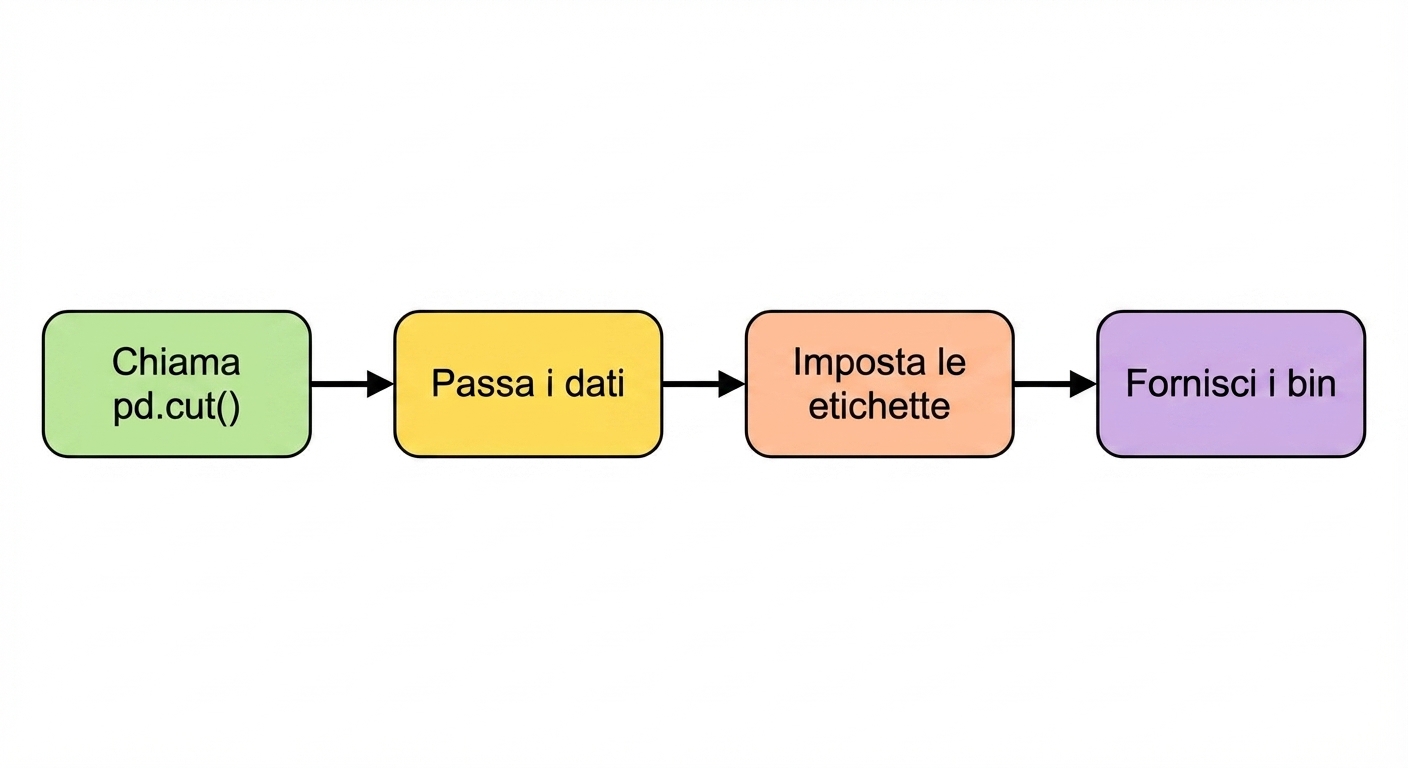
planes["Price_Category"] = pd.cut(planes["Price"],
                                  labels=labels,
                                  bins=bins)
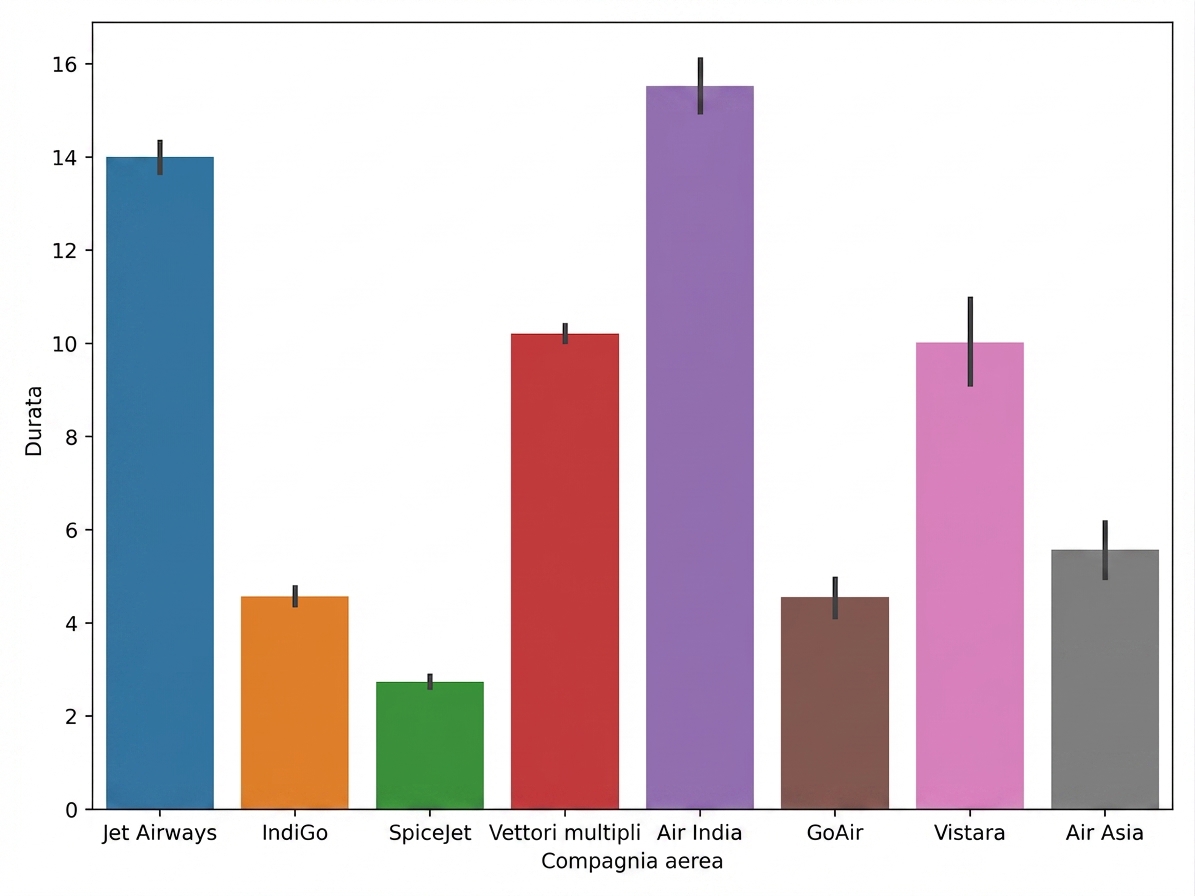
Data snooping
Generare ipotesi
sns.barplot(data=planes, x="Airline", y="Duration")
plt.show()