The grammar of graphics
Introduzione alla visualizzazione dei dati con ggplot2

Rick Scavetta
Founder, Scavetta Academy
The quick brown fox jumps over the lazy dog
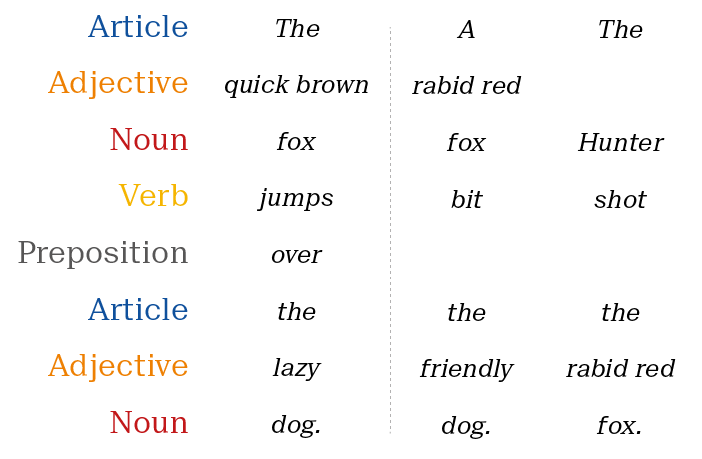
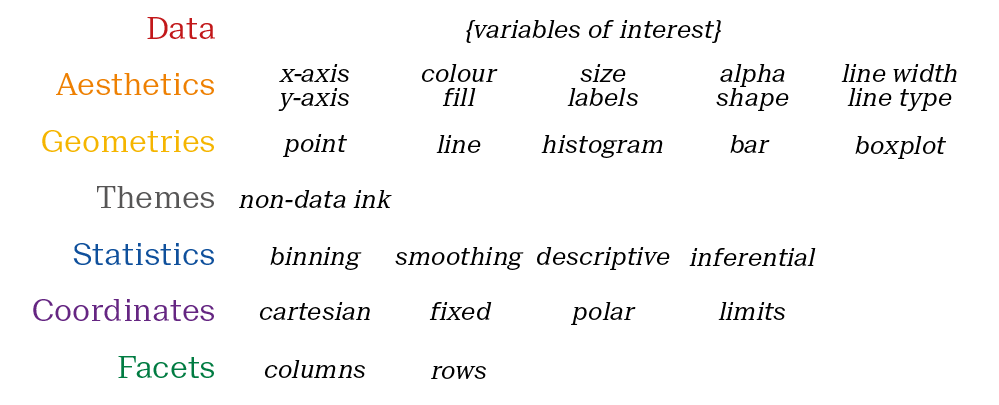
Grammar of graphics
Jargon for each element
Introduzione alla visualizzazione dei dati con ggplot2
Rick Scavetta
Founder, Scavetta Academy

