Visible aesthetics
Introduzione alla visualizzazione dei dati con ggplot2

Rick Scavetta
Founder, Scavetta Academy
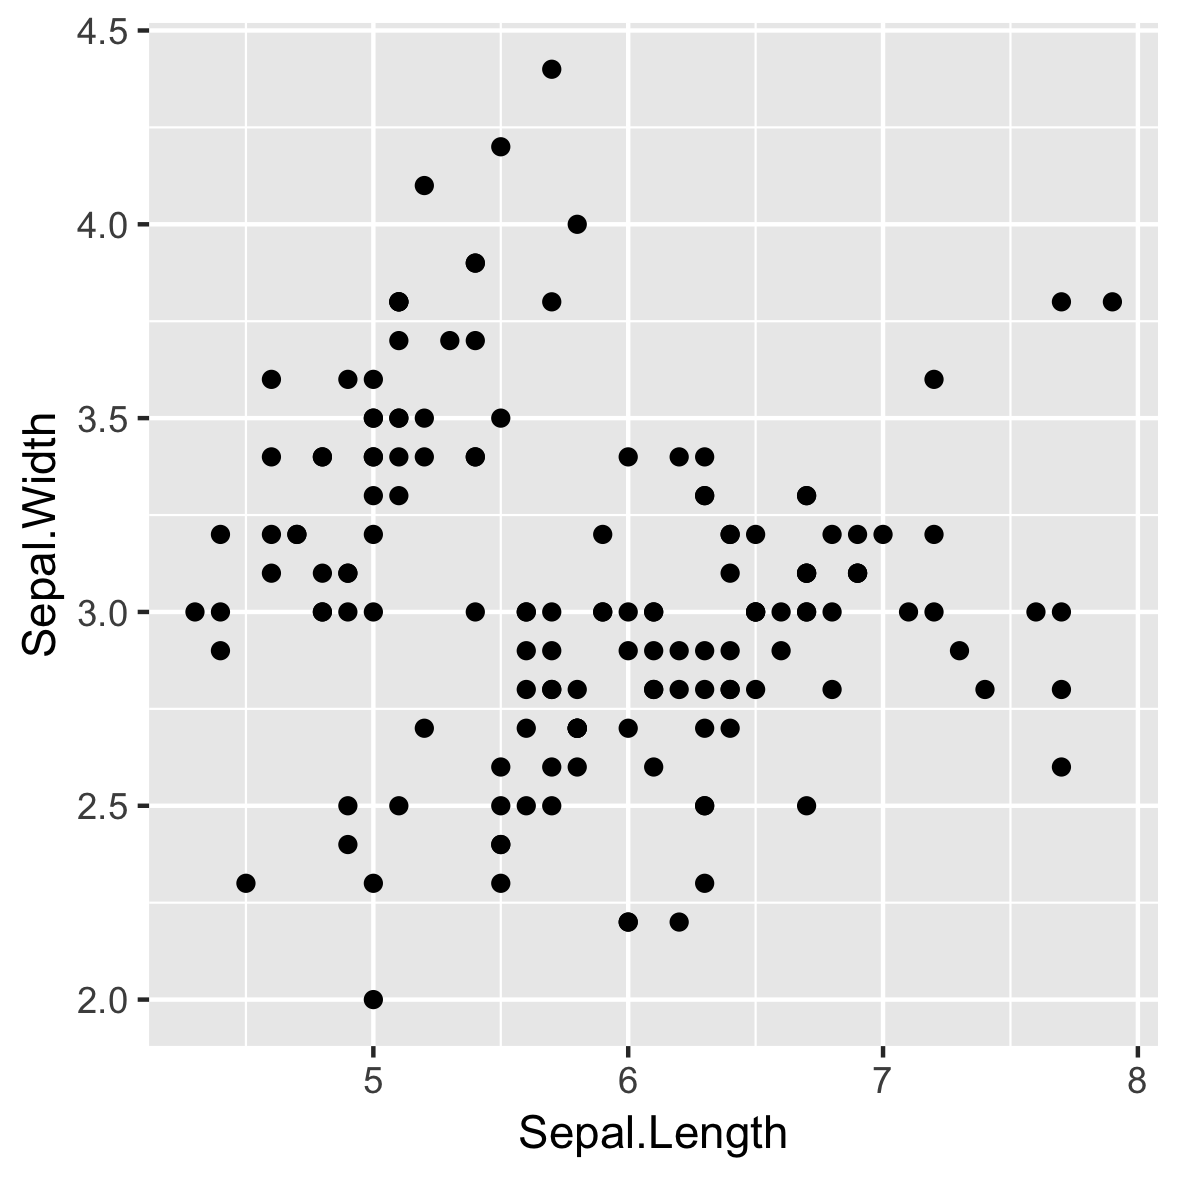
Mapping onto the X and Y axes
Mapping onto color
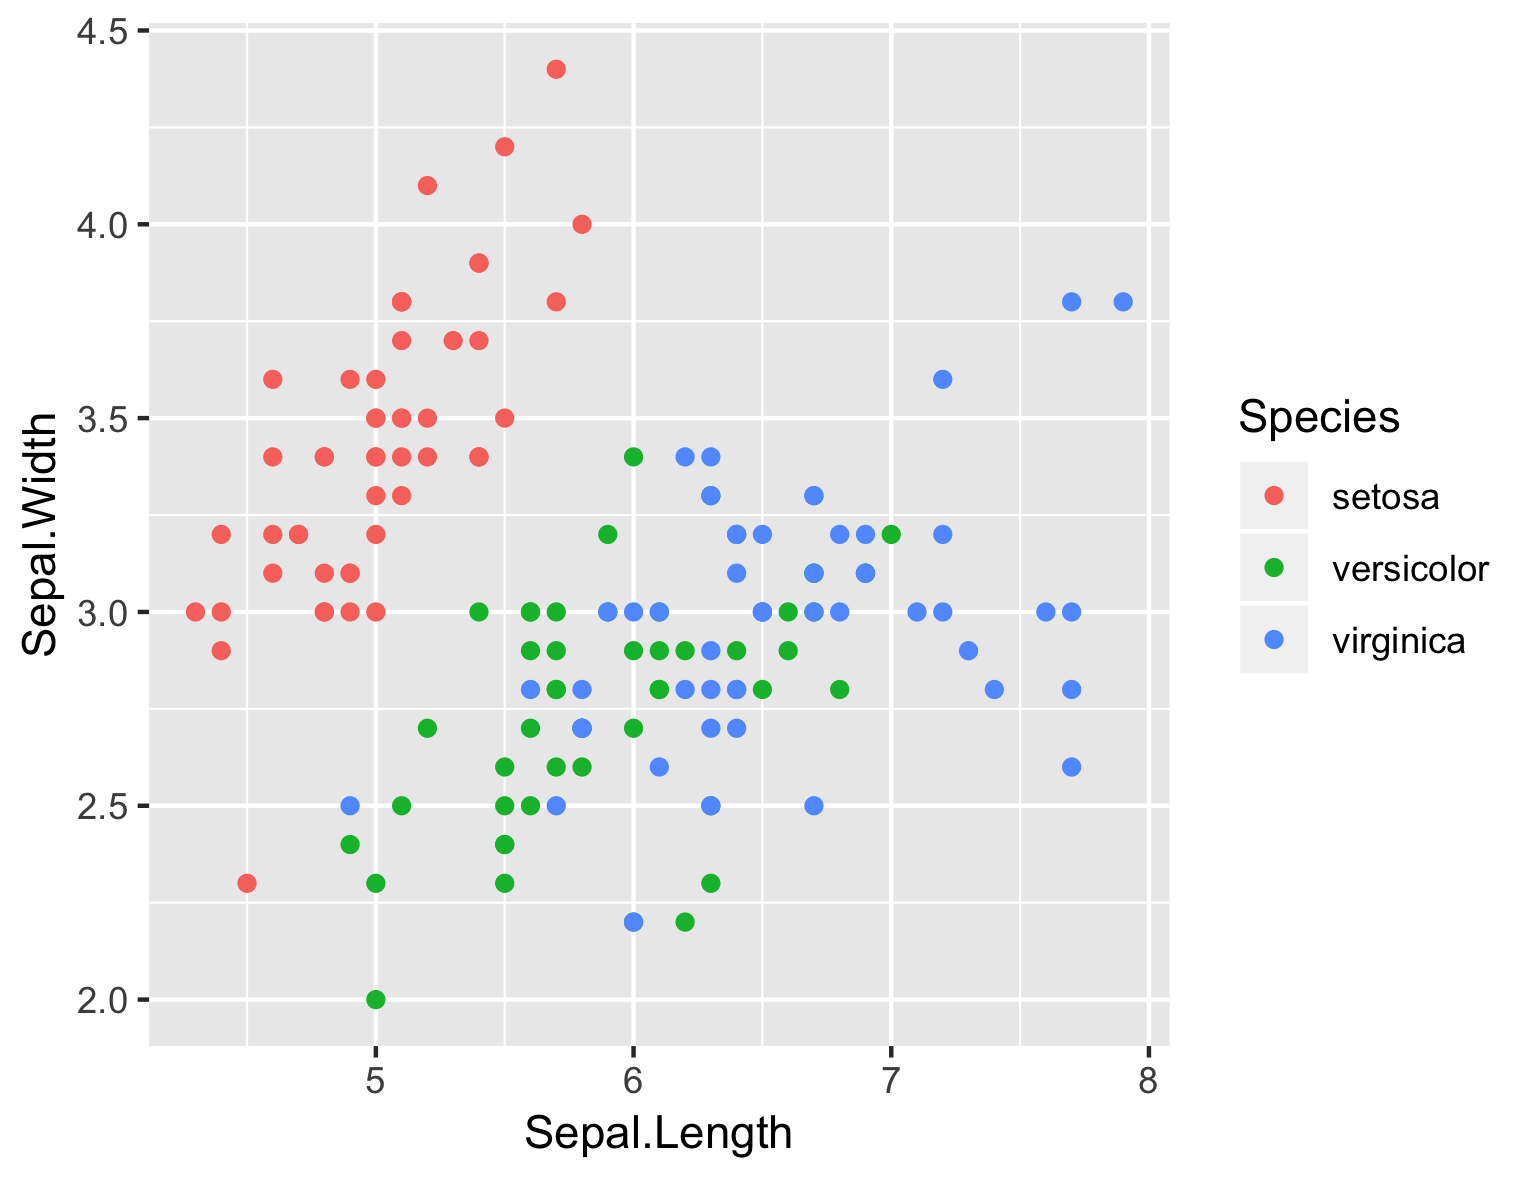
Mapping onto the color aesthetic
Mapping onto the color aesthetic
Mapping onto the color aesthetic in geom


