Histograms

Introduzione alla visualizzazione dei dati con ggplot2

Rick Scavetta

Founder, Scavetta Academy

Common plot types

Plot type Possible Geoms
Scatter plots points, jitter, abline, smooth, count
Bar plots histogram, bar, col, errorbar
Line plots line, path
Introduzione alla visualizzazione dei dati con ggplot2

Histograms

ggplot(iris, aes(x = Sepal.Width)) + 
  geom_histogram()
  • A plot of binned values
    • i.e. a statistical function
`stat_bin()` using `bins = 30`.
Pick better value with `binwidth`.

Introduzione alla visualizzazione dei dati con ggplot2

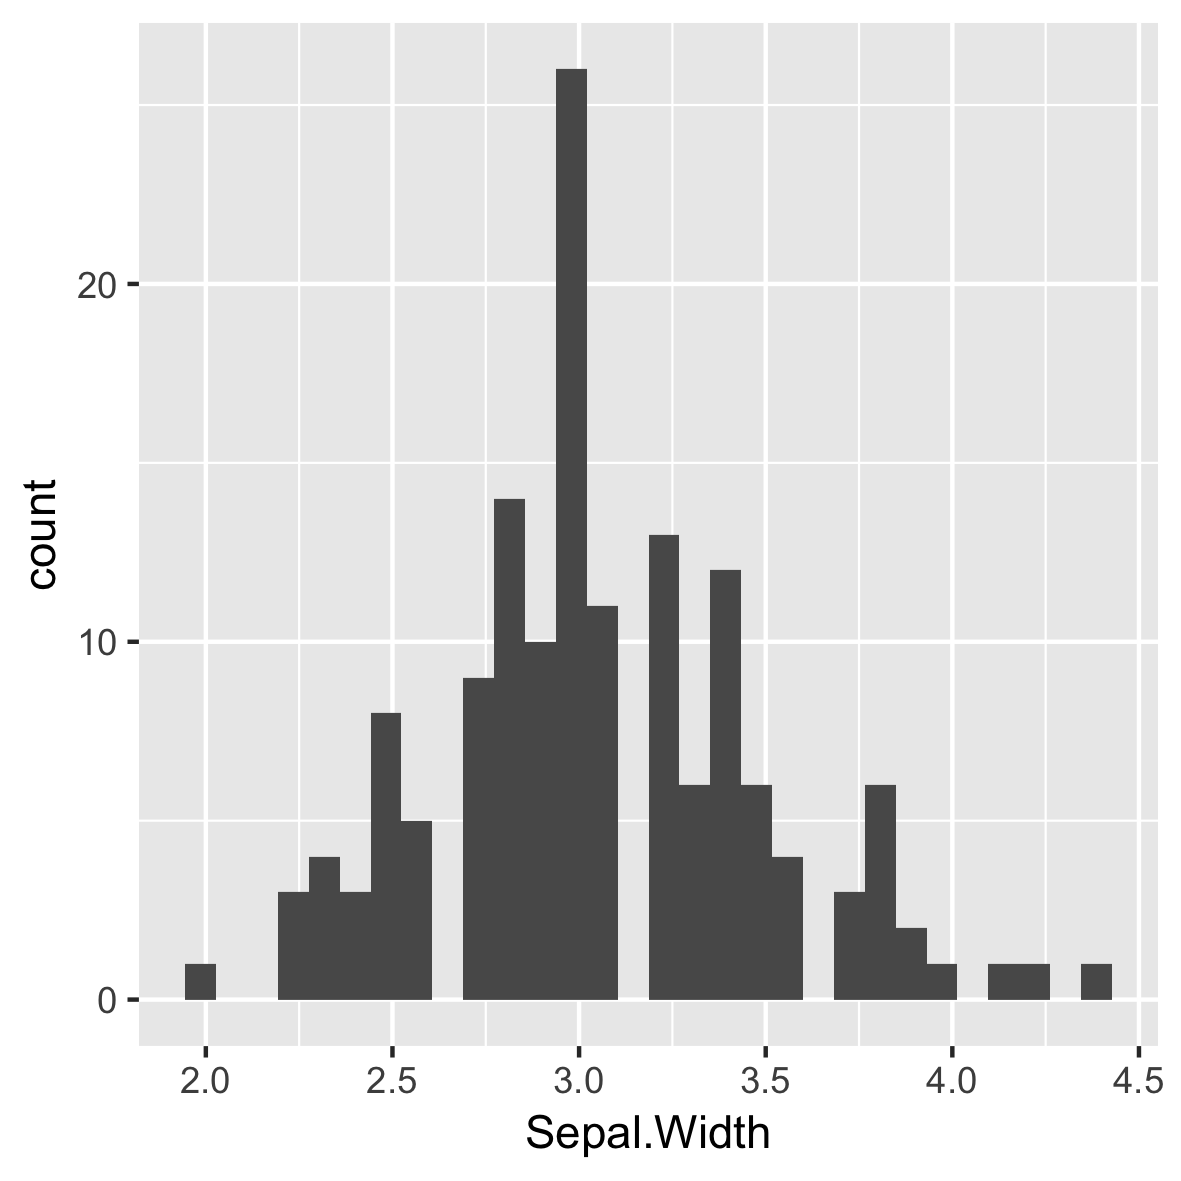
Default of 30 even bins

ggplot(iris, aes(x = Sepal.Width)) + 
  geom_histogram()
  • A plot of binned values
    • i.e. a statistical function
# Default bin width:
diff(range(iris$Sepal.Width))/30
[1] 0.08

Introduzione alla visualizzazione dei dati con ggplot2

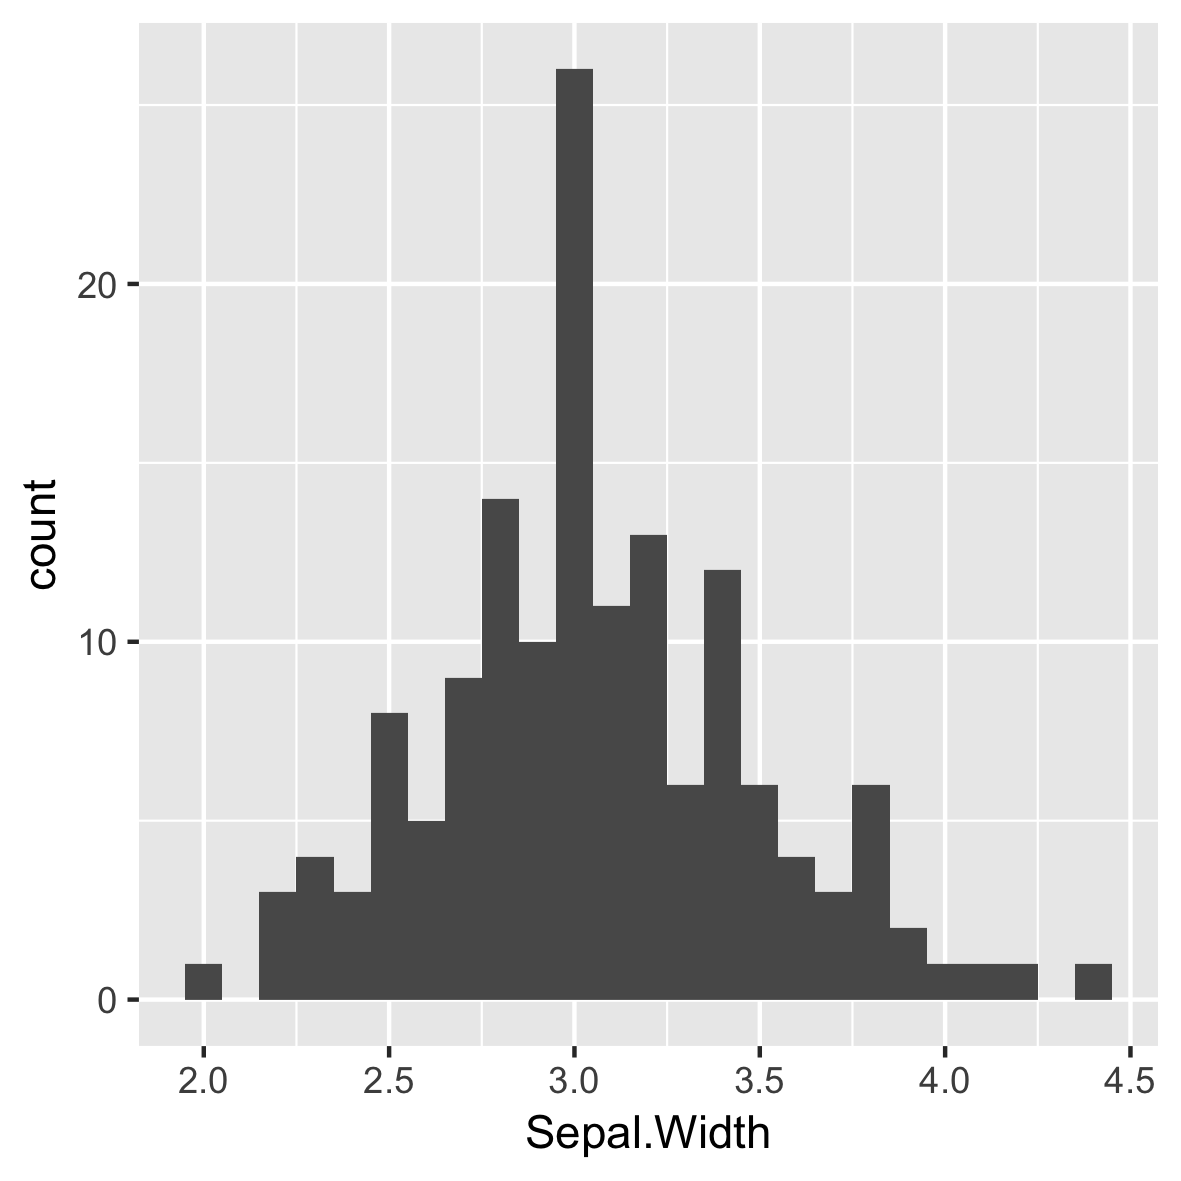
Intuitive and meaningful bin widths

ggplot(iris, aes(x = Sepal.Width)) + 
  geom_histogram(binwidth = 0.1)
  • Always set a meaningful bin widths for your data.

  • No spaces between bars.

Introduzione alla visualizzazione dei dati con ggplot2

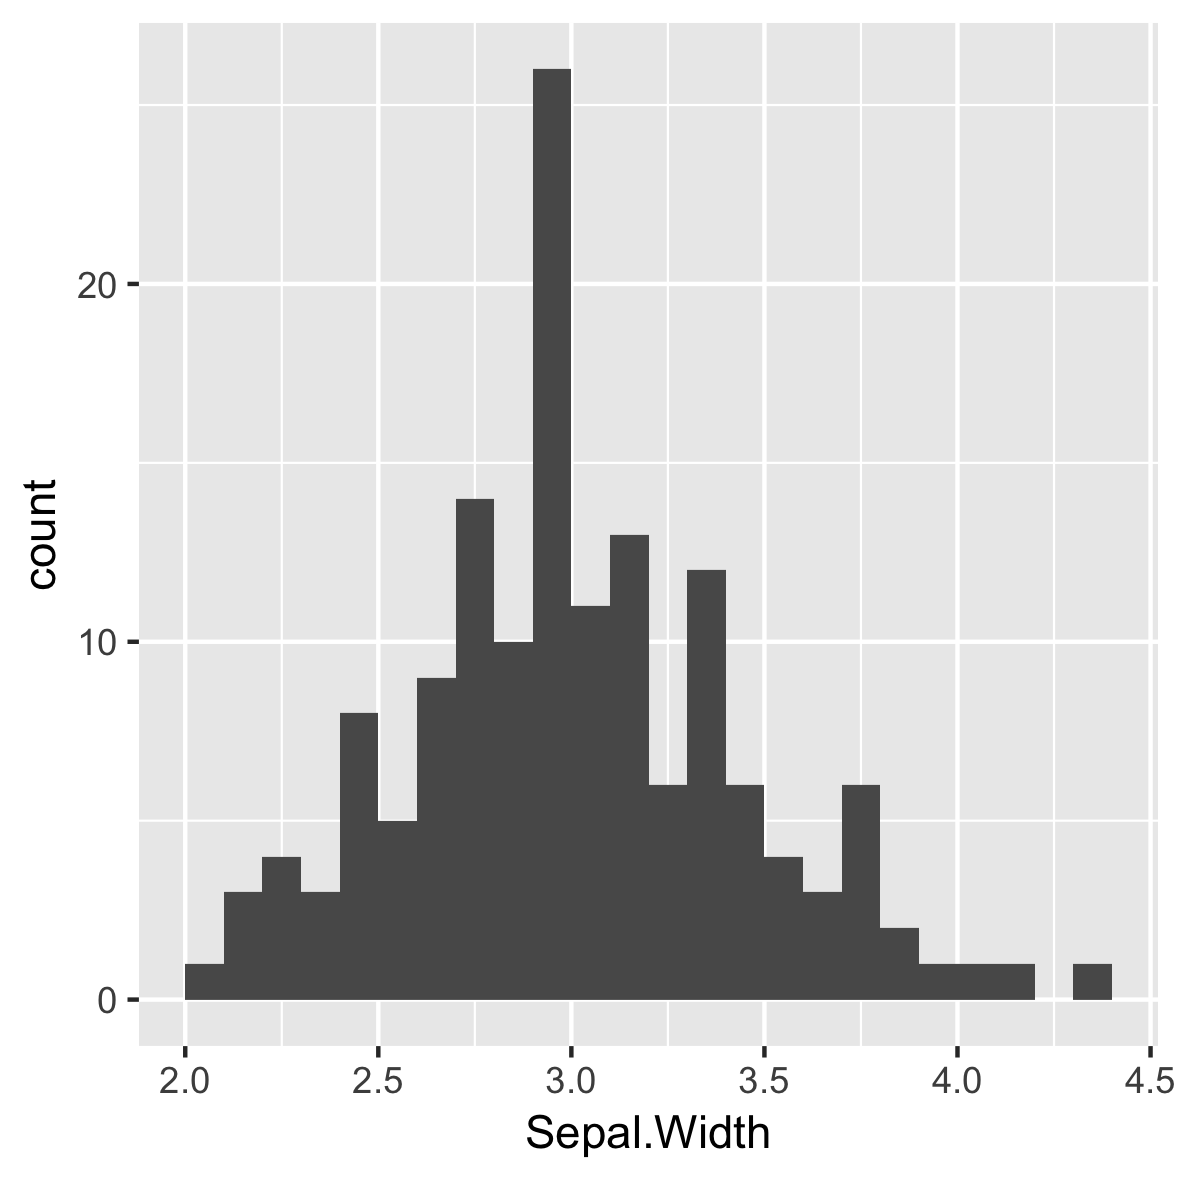
Re-position tick marks
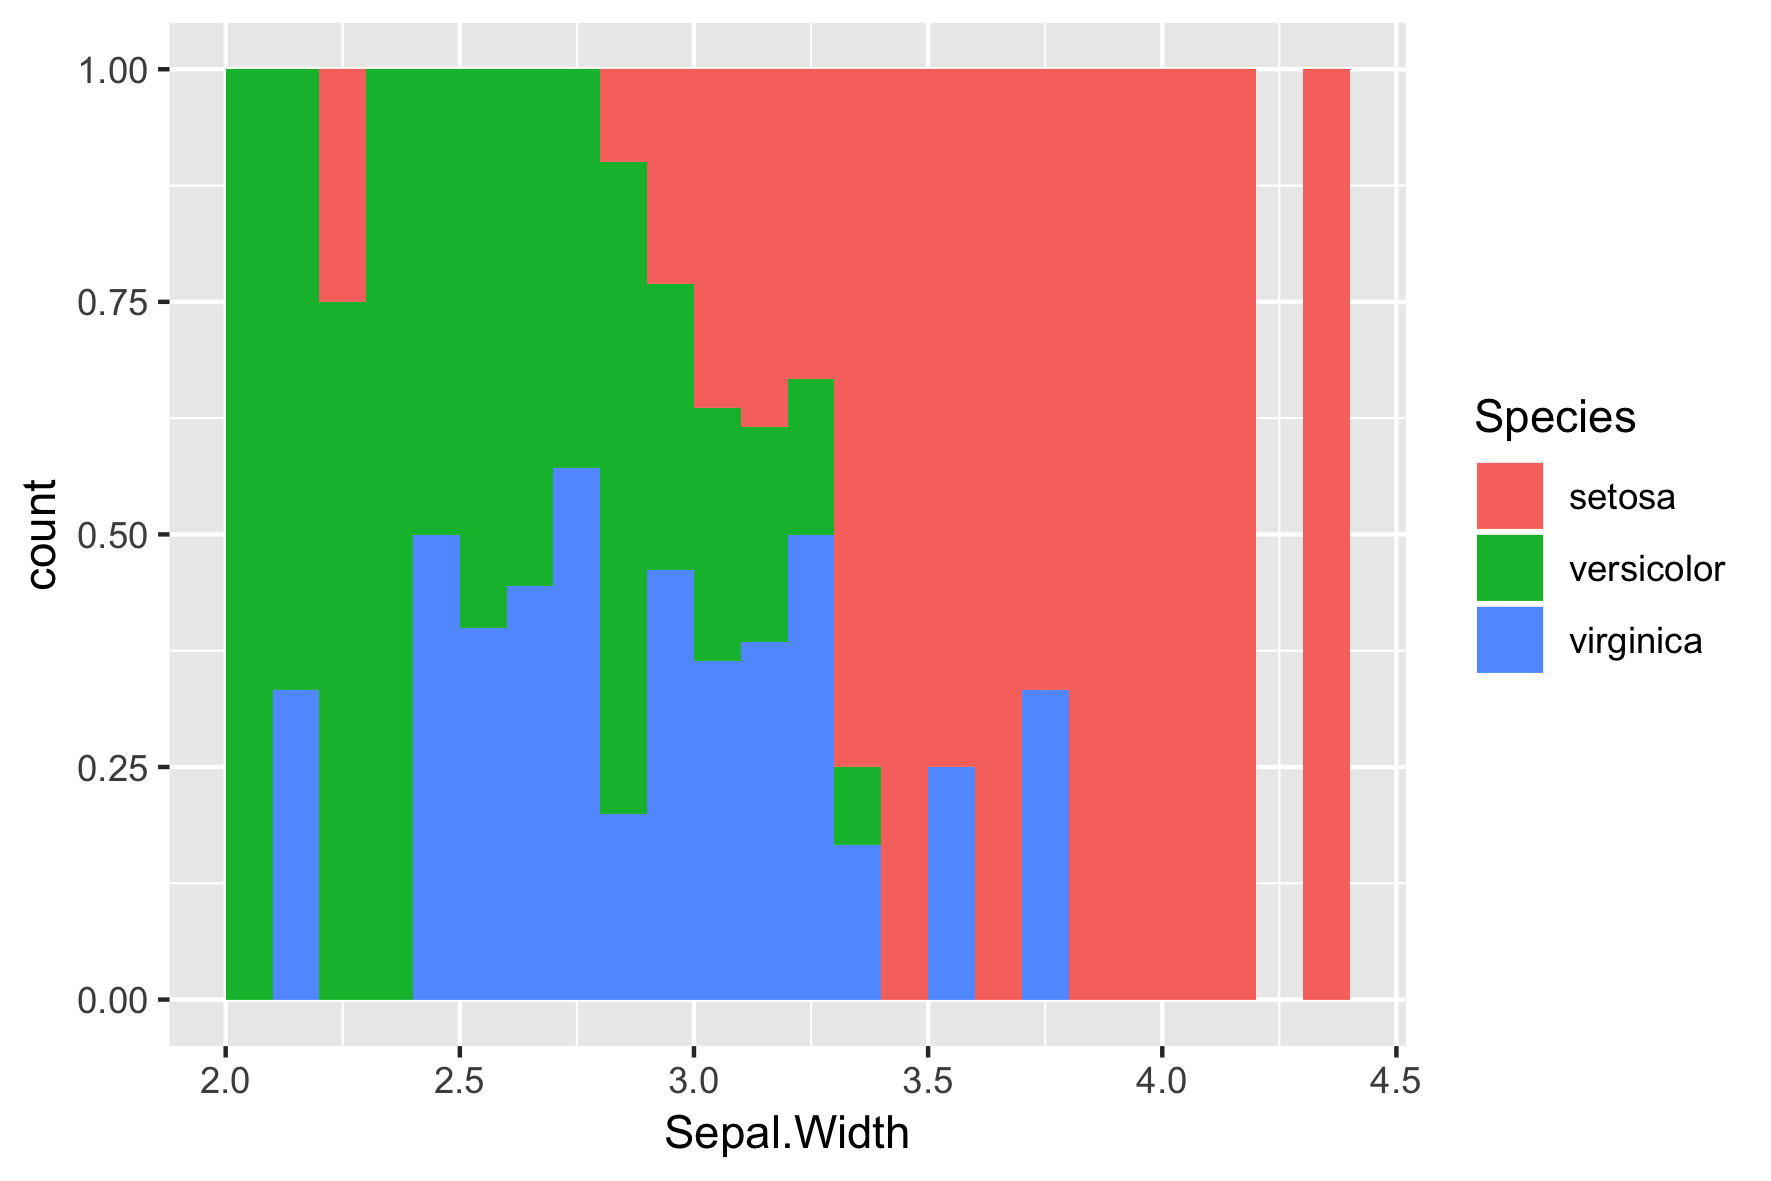
ggplot(iris, aes(x = Sepal.Width)) + 
  geom_histogram(binwidth = 0.1,
                 center = 0.05)
  • Always set a meaningful bin widths for your data.

  • No spaces between bars.

  • X axis labels are between bars.

Introduzione alla visualizzazione dei dati con ggplot2

Different Species

ggplot(iris, aes(x = Sepal.Width, 
                 fill = Species)) + 
  geom_histogram(binwidth = .1, 
                 center = 0.05)

Introduzione alla visualizzazione dei dati con ggplot2

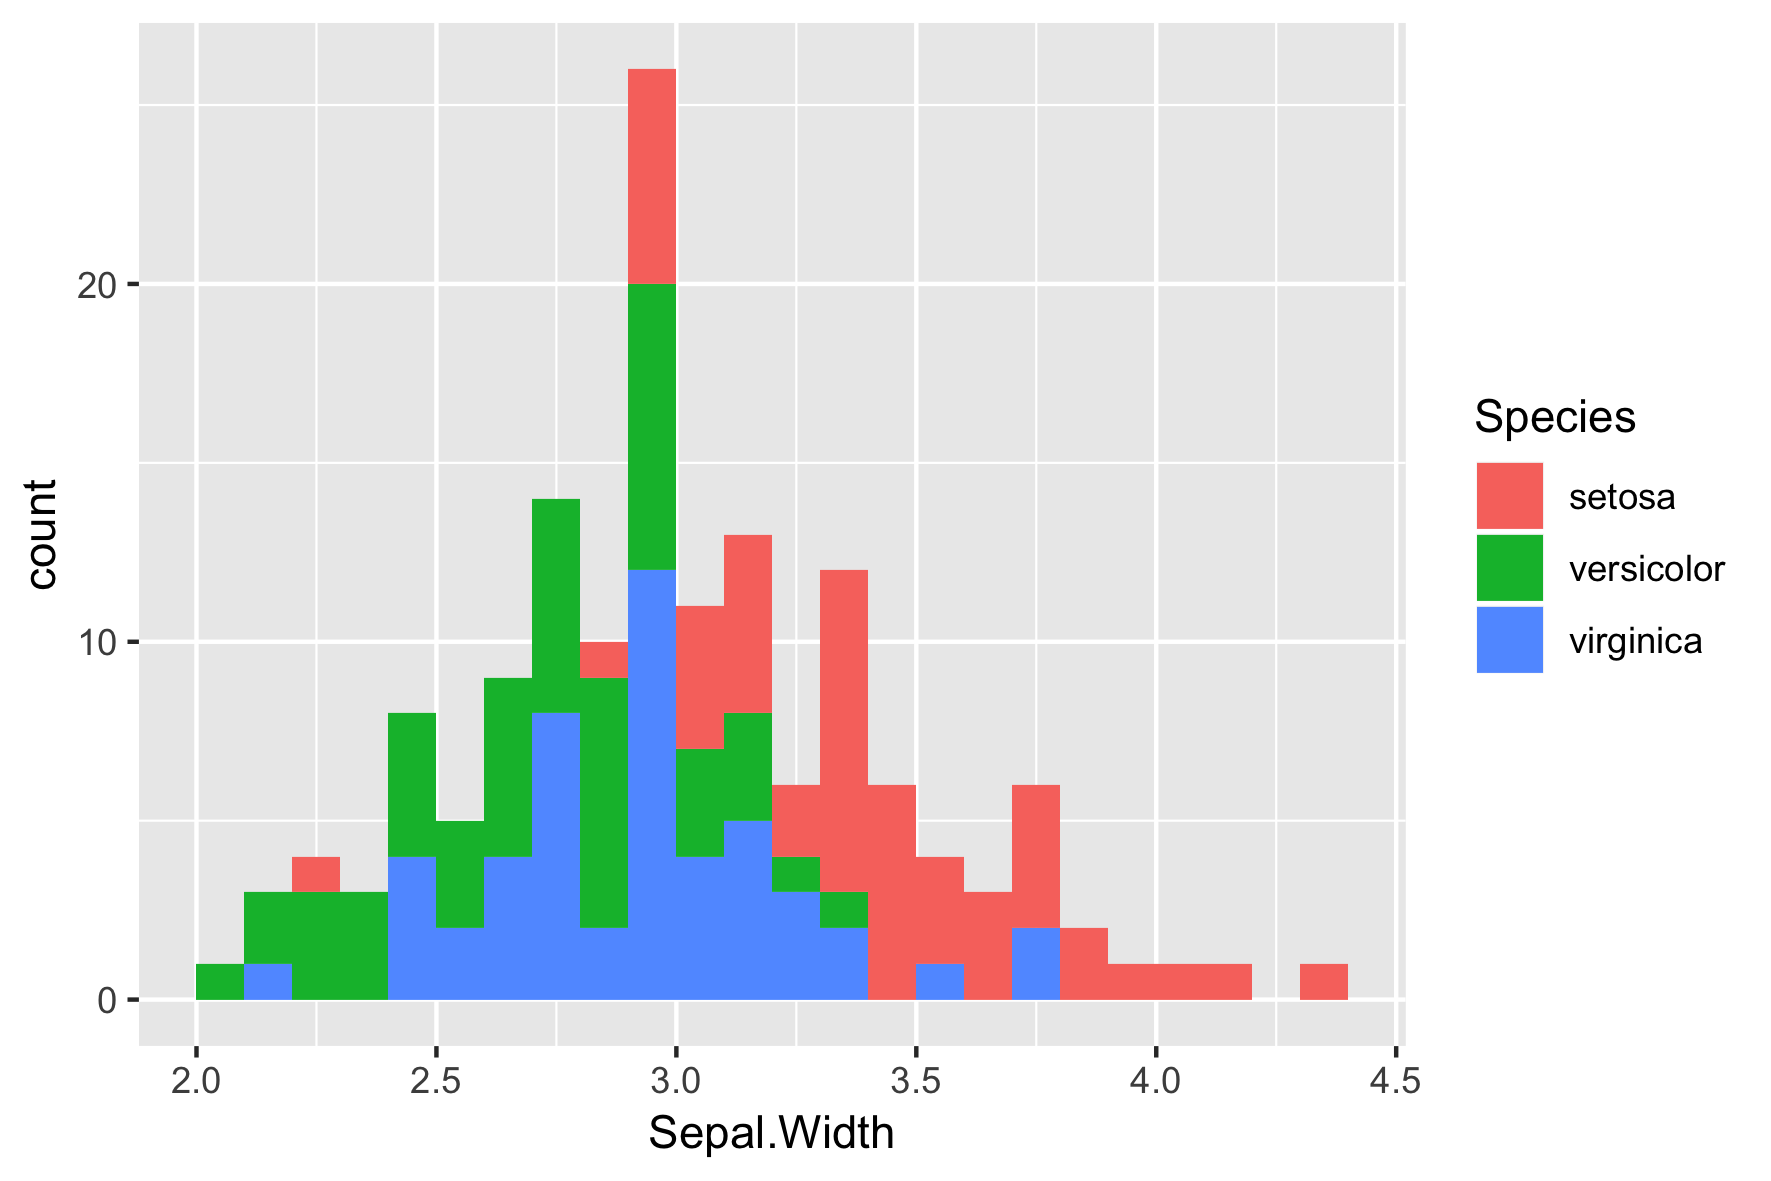
Default position is "stack"
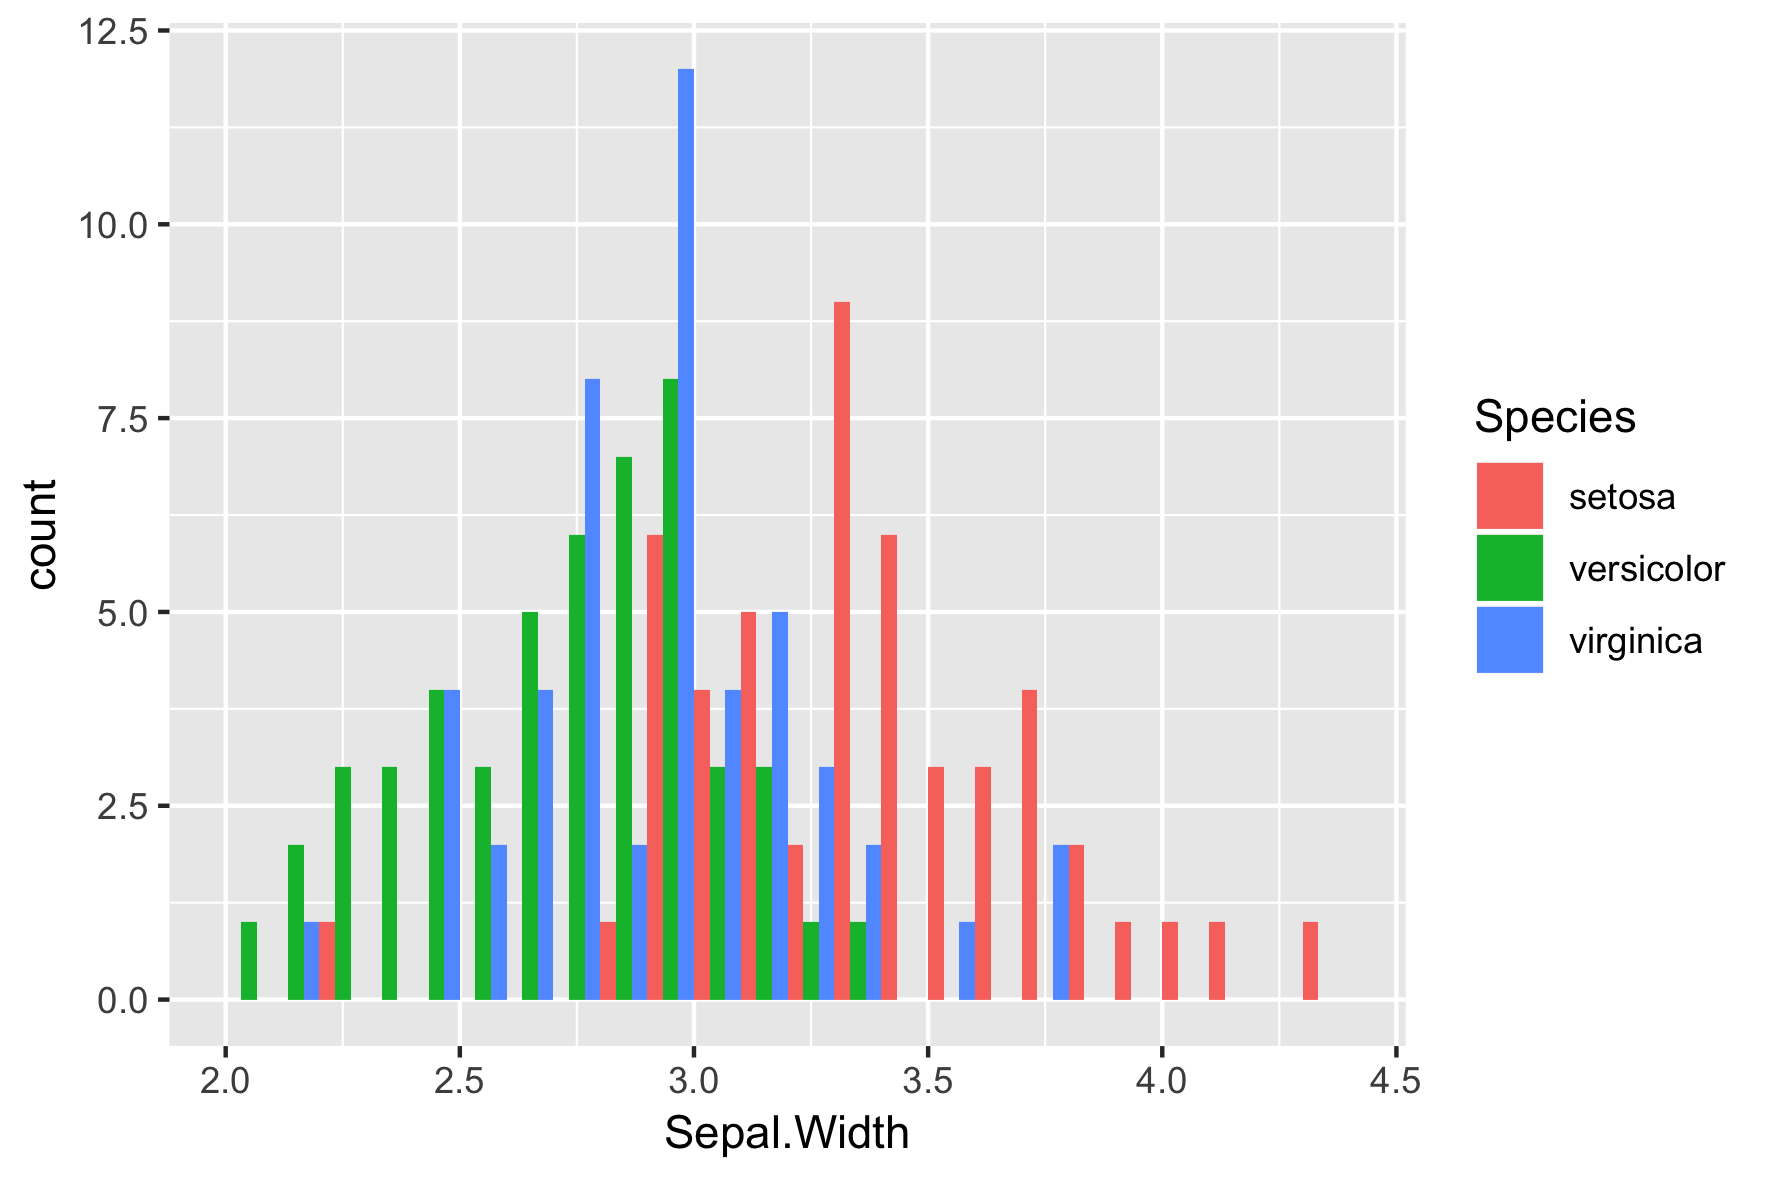
ggplot(iris, aes(x = Sepal.Width,
                 fill = Species)) + 
  geom_histogram(binwidth = .1, 
                 center = 0.05,
                 position = "stack") 

Introduzione alla visualizzazione dei dati con ggplot2

position = "dodge"

ggplot(iris, aes(x = Sepal.Width, 
                 fill = Species)) + 
  geom_histogram(binwidth = .1, 
                 center = 0.05, 
                 position = "dodge")

Introduzione alla visualizzazione dei dati con ggplot2

position = "fill"

ggplot(iris, aes(x = Sepal.Width, 
                 fill = Species)) + 
  geom_histogram(binwidth = .1, 
                 center = 0.05, 
                 position = "fill")  

Introduzione alla visualizzazione dei dati con ggplot2

Final Slide

Introduzione alla visualizzazione dei dati con ggplot2

Preparing Video For Download...