Statistical plotting

Introduzione alla visualizzazione dei dati con Matplotlib

Ariel Rokem

Data Scientist

Adding error bars to bar charts

fig, ax = plt.subplots()

ax.bar("Rowing",
       mens_rowing["Height"].mean(),
       yerr=mens_rowing["Height"].std())

ax.bar("Gymnastics",
       mens_gymnastics["Height"].mean(),
       yerr=mens_gymnastics["Height"].std())

ax.set_ylabel("Height (cm)")

plt.show()
Introduzione alla visualizzazione dei dati con Matplotlib

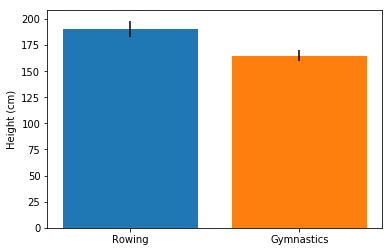
Error bars in a bar chart
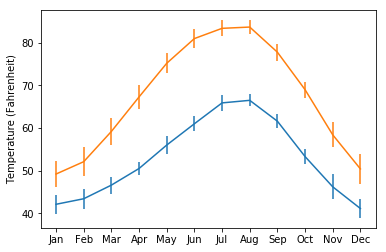
Introduzione alla visualizzazione dei dati con Matplotlib

Adding error bars to plots

fig, ax = plt.subplots()

ax.errorbar(seattle_weather["MONTH"],
            seattle_weather["MLY-TAVG-NORMAL"],
            yerr=seattle_weather["MLY-TAVG-STDDEV"])

ax.errorbar(austin_weather["MONTH"],
            austin_weather["MLY-TAVG-NORMAL"],
            yerr=austin_weather["MLY-TAVG-STDDEV"])

ax.set_ylabel("Temperature (Fahrenheit)")

plt.show()
Introduzione alla visualizzazione dei dati con Matplotlib

Error bars in plots

Introduzione alla visualizzazione dei dati con Matplotlib

Adding boxplots

fig, ax = plt.subplots()

ax.boxplot([mens_rowing["Height"], mens_gymnastics["Height"]])
ax.set_xticklabels(["Rowing", "Gymnastics"]) ax.set_ylabel("Height (cm)") plt.show()
Introduzione alla visualizzazione dei dati con Matplotlib

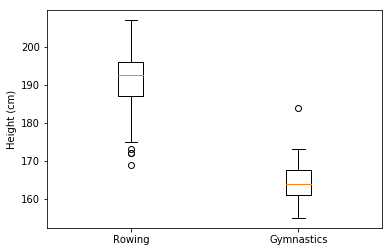
Interpreting boxplots

Introduzione alla visualizzazione dei dati con Matplotlib

Try it yourself!

Introduzione alla visualizzazione dei dati con Matplotlib

Preparing Video For Download...