Introduzione alla visualizzazione dei dati con Seaborn
Content Team
DataCamp
What is pandas?
Python library for data analysis
Easily read datasets from csv, txt, and other types of files
Datasets take the form of DataFrame objects
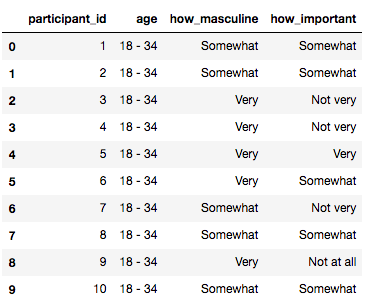
Working with DataFrames
import pandas as pd

df = pd.read_csv("masculinity.csv")

df.head()
    participant_id        age    how_masculine    how_important
0                1    18 - 34         Somewhat         Somewhat
1                2    18 - 34         Somewhat         Somewhat
2                3    18 - 34             Very         Not very
3                4    18 - 34             Very         Not very
4                5    18 - 34             Very             Very
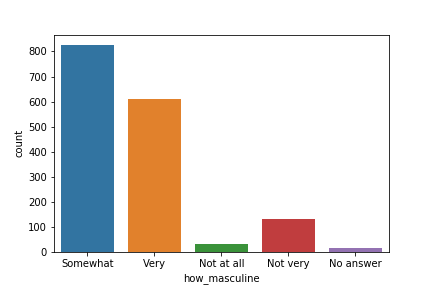
Using DataFrames with countplot()
import pandas as pd
import matplotlib.pyplot as plt
import seaborn as sns

df = pd.read_csv("masculinity.csv")

sns.countplot(x="how_masculine",
              data=df)

plt.show()
Let's practice!
Introduzione alla visualizzazione dei dati con Seaborn