Introduction to Seaborn
Introduzione alla visualizzazione dei dati con Seaborn

Content Team
DataCamp
What is Seaborn?
1 Waskom, M. L. (2021). seaborn: statistical data visualization. https://seaborn.pydata.org/
Why is Seaborn useful?
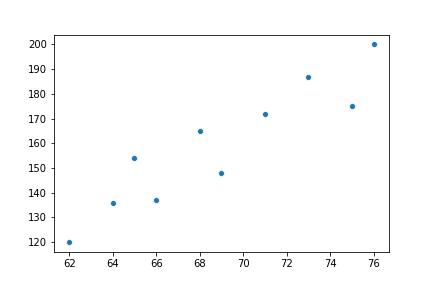
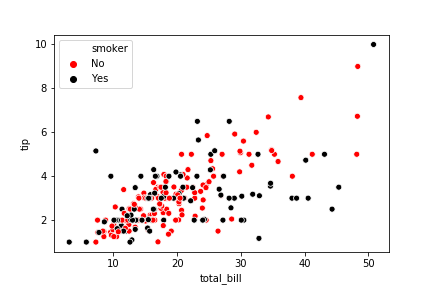
Example 1: Scatter plot
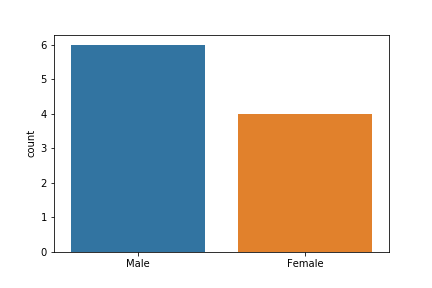
Example 2: Create a count plot
1 Waskom, M. L. (2021). seaborn: statistical data visualization. https://seaborn.pydata.org/

