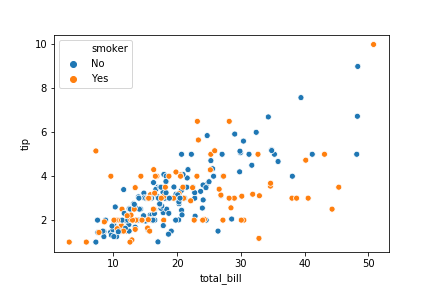
Adding a third variable with hue
Introduzione alla visualizzazione dei dati con Seaborn

Content Team
DataCamp
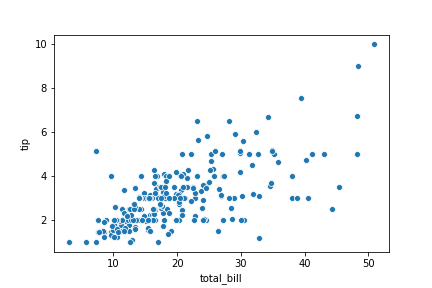
A basic scatter plot
1 Waskom, M. L. (2021). seaborn: statistical data visualization. https://seaborn.pydata.org/
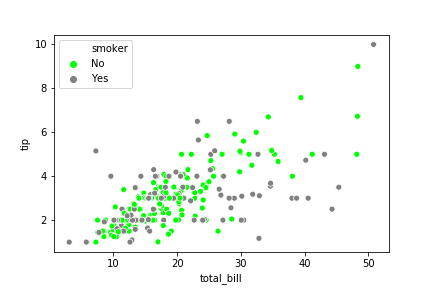
A scatter plot with hue
1 Waskom, M. L. (2021). seaborn: statistical data visualization. https://seaborn.pydata.org/
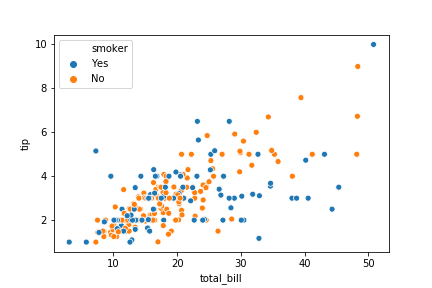
Setting hue order
1 Waskom, M. L. (2021). seaborn: statistical data visualization. https://seaborn.pydata.org/
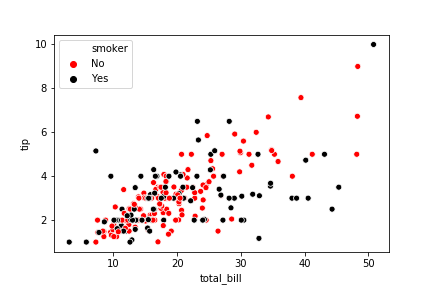
Specifying hue colors
1 Waskom, M. L. (2021). seaborn: statistical data visualization. https://seaborn.pydata.org/
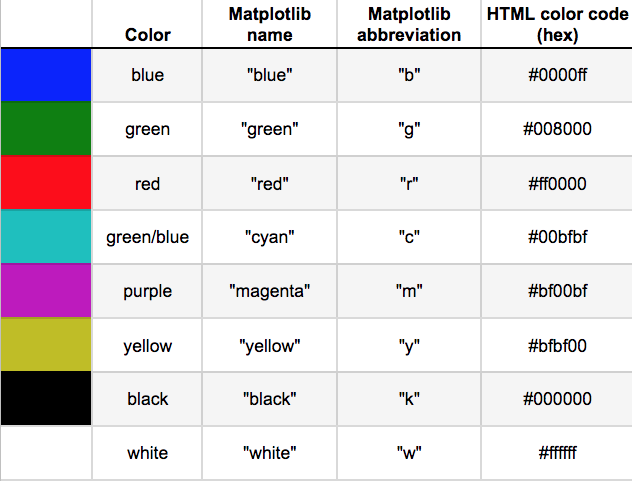
Using HTML hex color codes with hue
1 Waskom, M. L. (2021). seaborn: statistical data visualization. https://seaborn.pydata.org/
Using hue with count plots
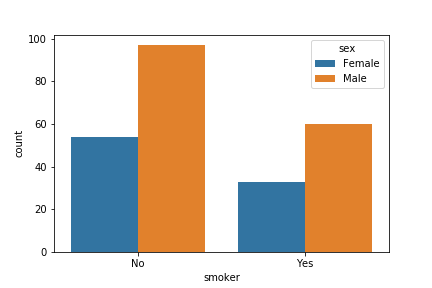
1 Waskom, M. L. (2021). seaborn: statistical data visualization. https://seaborn.pydata.org/

