Creating line plots
Introduzione alla Data Science in Python

Hillary Green-Lerman
Lead Data Scientist, Looker
The plot thickens

From DataFrame to Visualization
Introducing Matplotlib
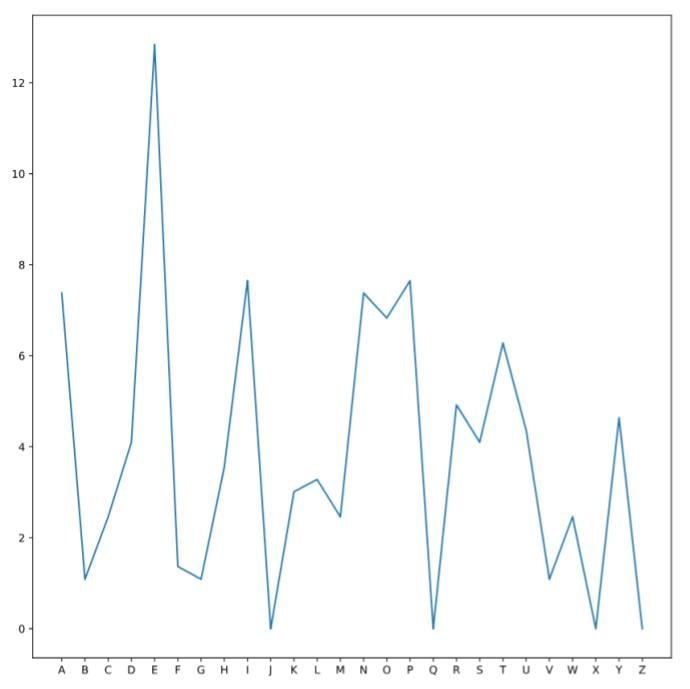
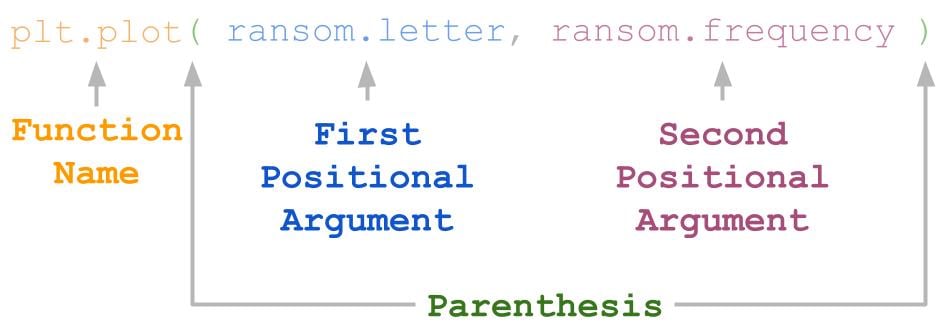
Line Plot
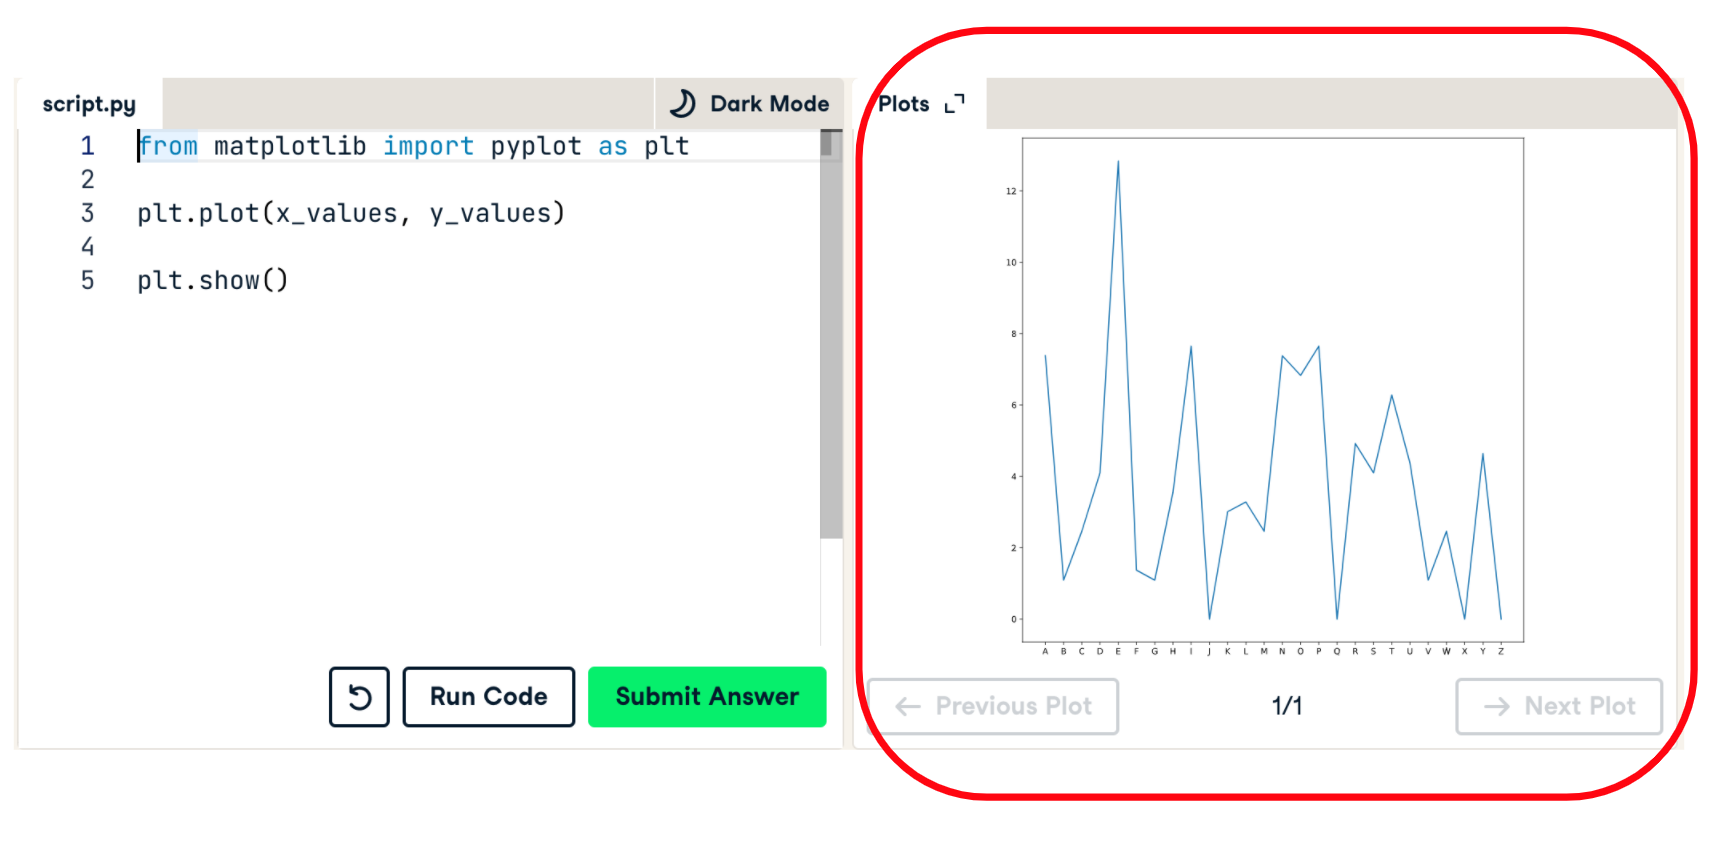
Displaying the Results
plt.show()
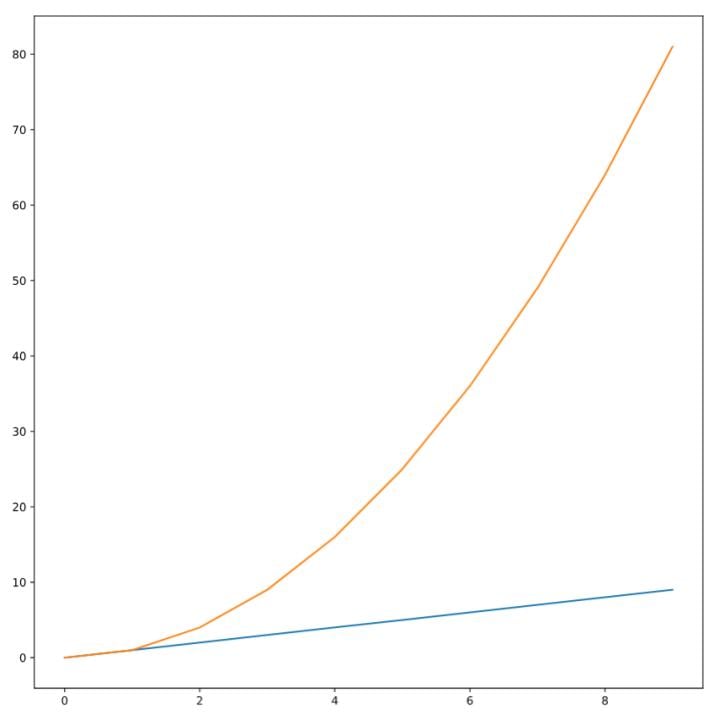
Multiple Lines
Introduzione alla Data Science in Python
Hillary Green-Lerman
Lead Data Scientist, Looker
plt.show()

