Histograms
Introduzione a Python per la finanza

Adina Howe
Professor
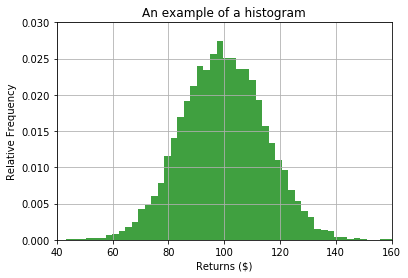
Why histograms for financial analysis?
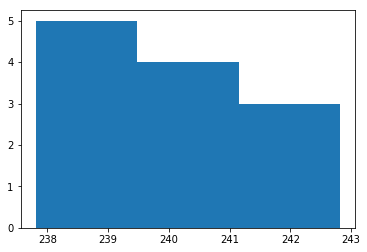
Histograms and matplotlib.pyplot
import matplotlib.pyplot as plt
plt.hist(x=prices, bins=3)
plt.show()
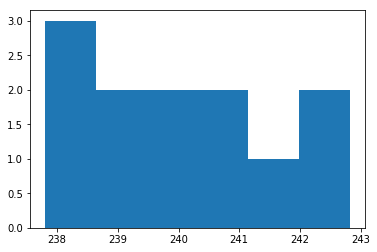
Changing the number of bins
import matplotlib.pyplot as plt
plt.hist(prices, bins=6)
plt.show()
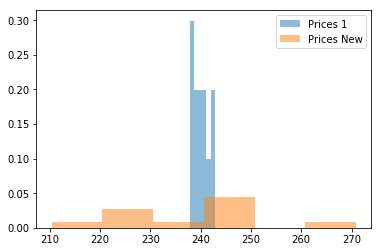
Normalizing histogram data
import matplotlib.pyplot as plt
plt.hist(prices, bins=6, density=True)
plt.show()
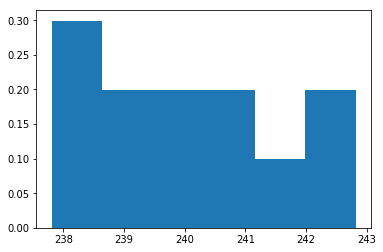
Histogram result
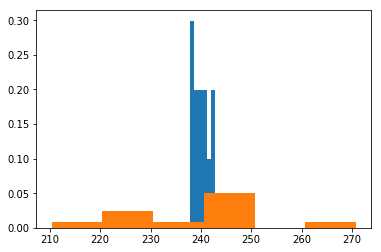
Histogram result
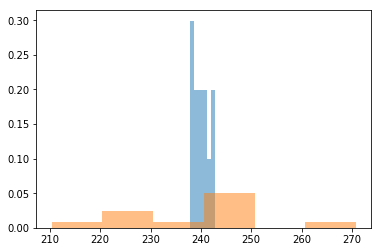
Histogram result