Visualization in Python
Introduzione a Python per la finanza

Adina Howe
Professor
Matplotlib: A visualization package
See more of the Matplotlib gallery by clicking this link.

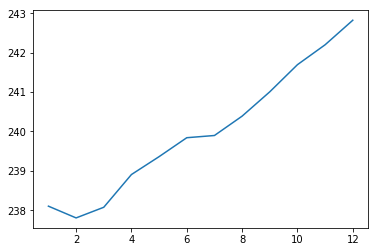
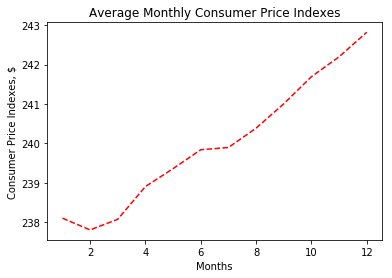
Plot result
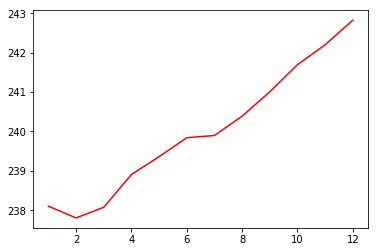
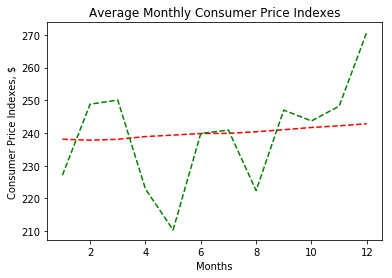
Plot result
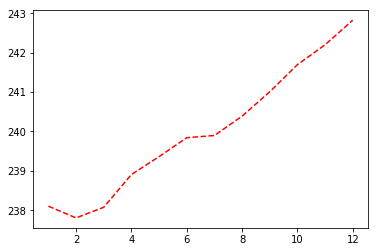
Plot result
Plot result
Plot result
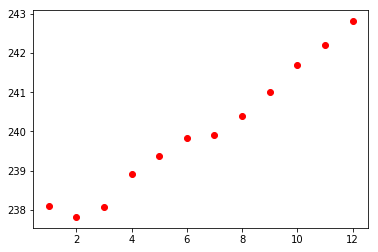
Scatterplot result