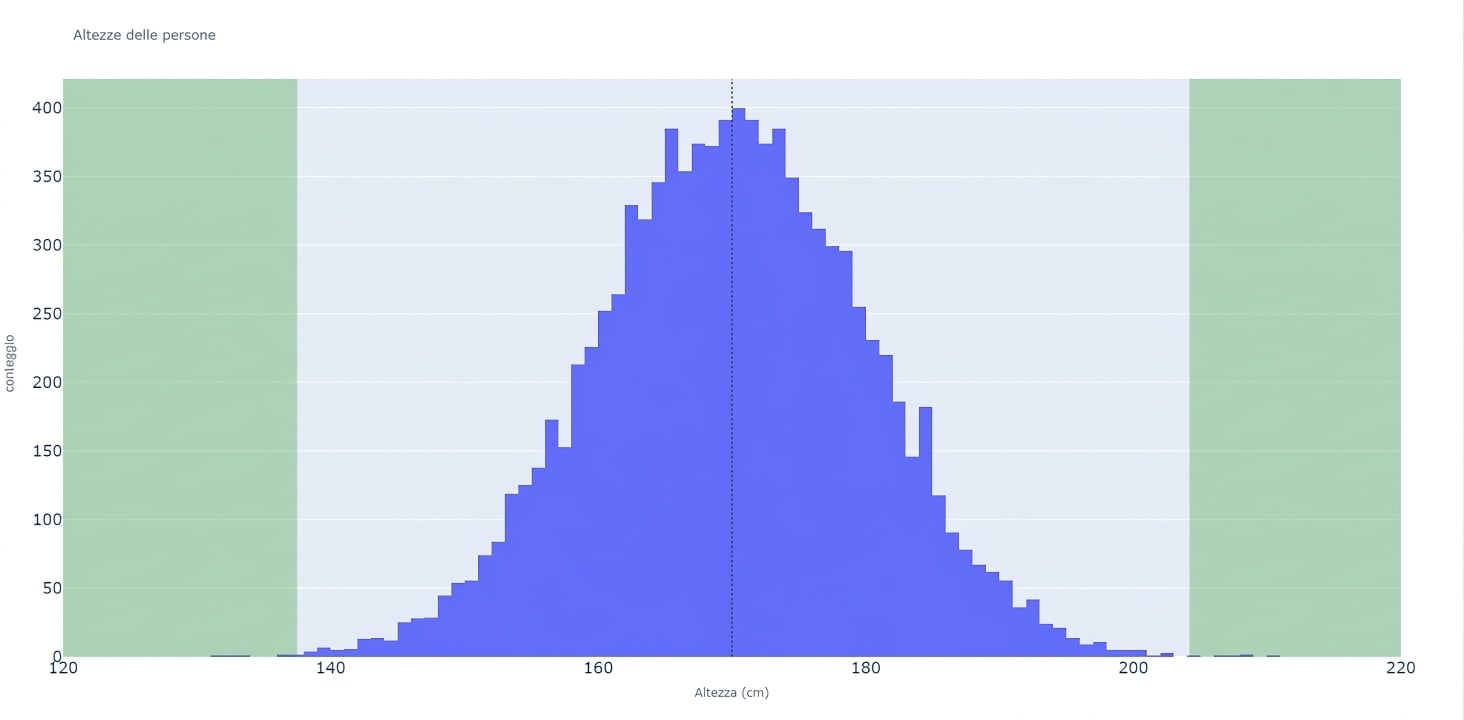
Distribuzioni e valori anomali
Analisi Esplorativa dei Dati in Power BI

Jacob H. Marquez
Data Scientist at Microsoft
Cosa sono gli istogrammi?
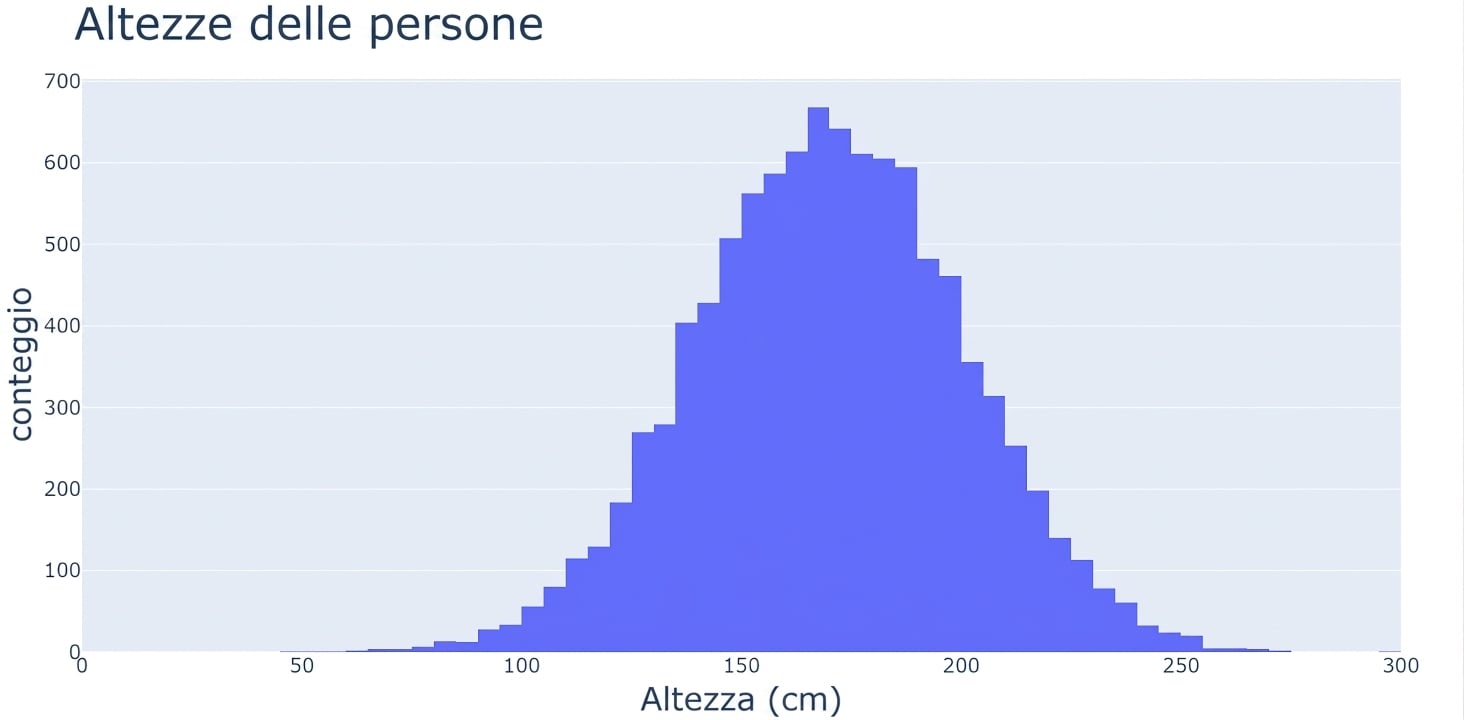
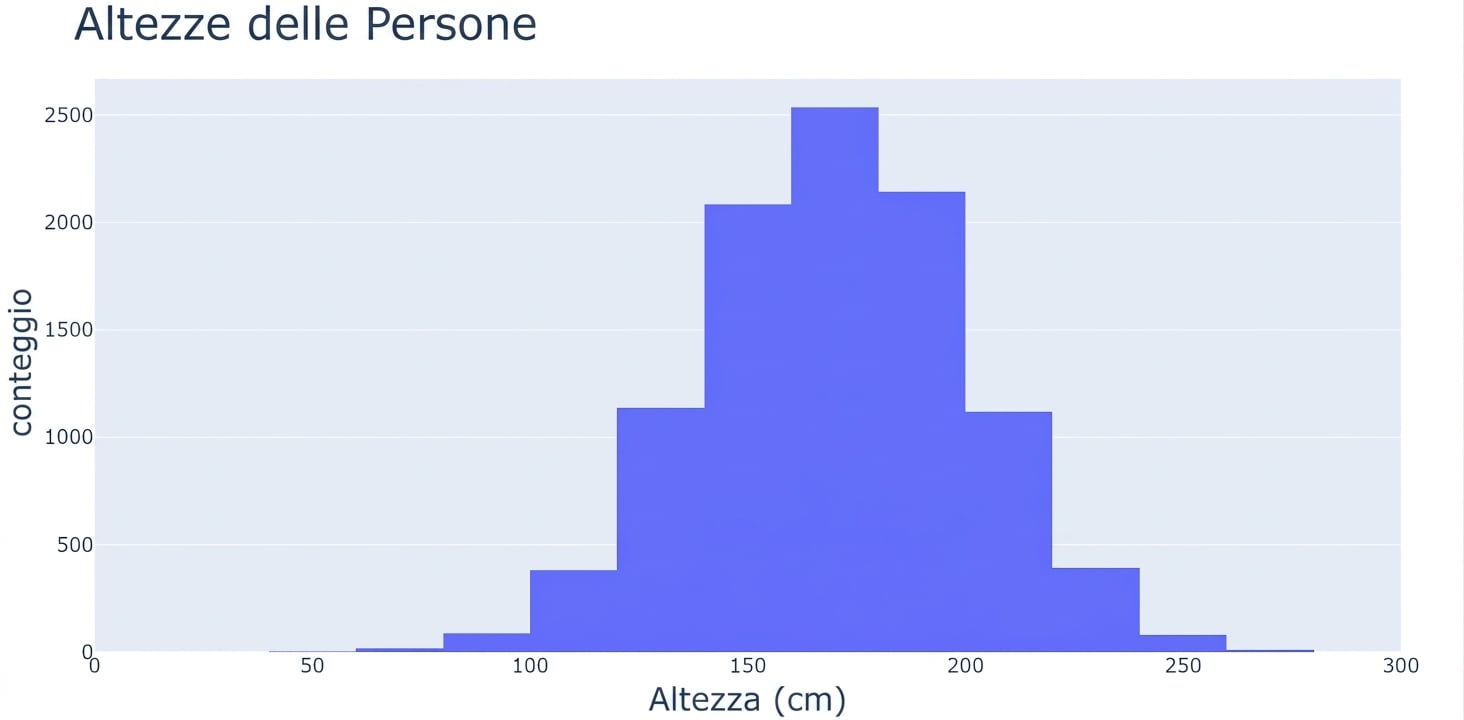
Cosa sono gli istogrammi? - bin
Istogramma con 100 bin
Istogramma con 20 bin
Leggere gli istogrammi - centralità e asimmetria
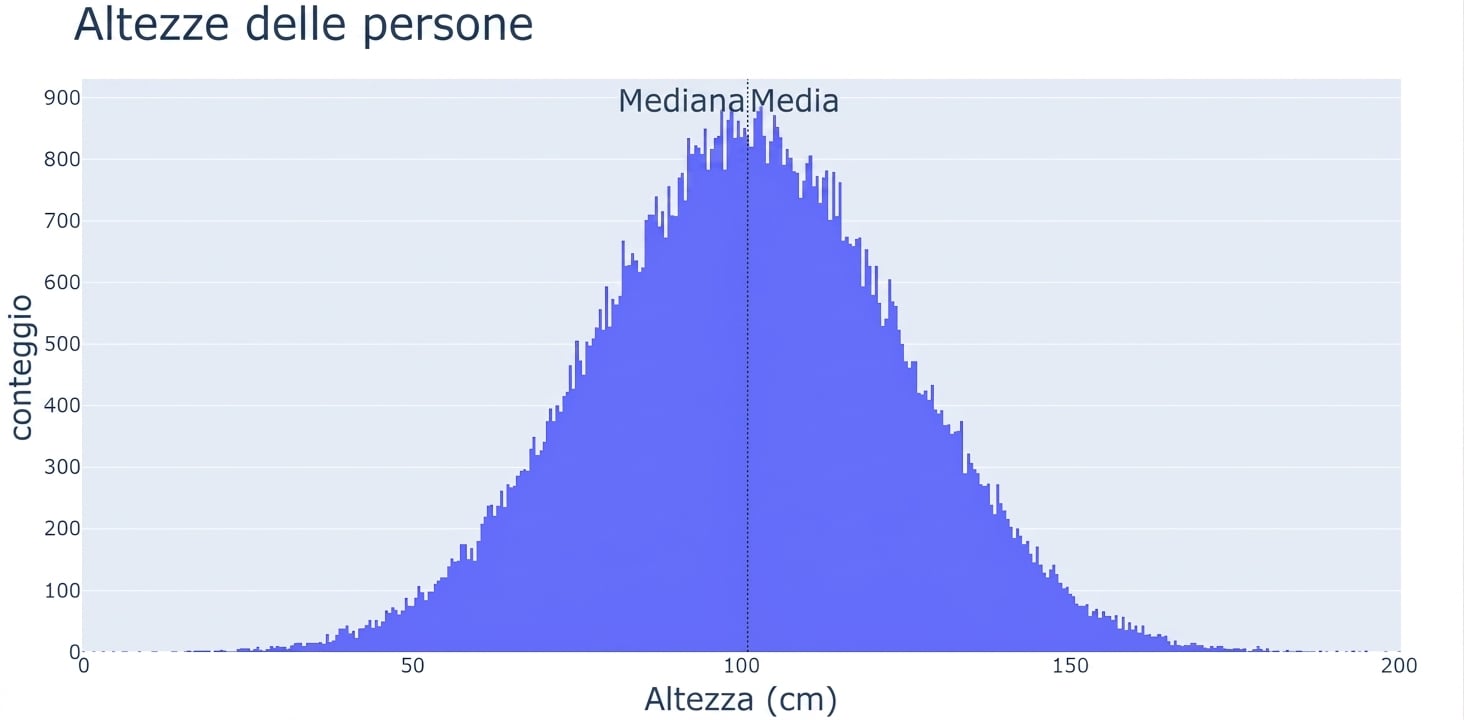
Distribuzione normale
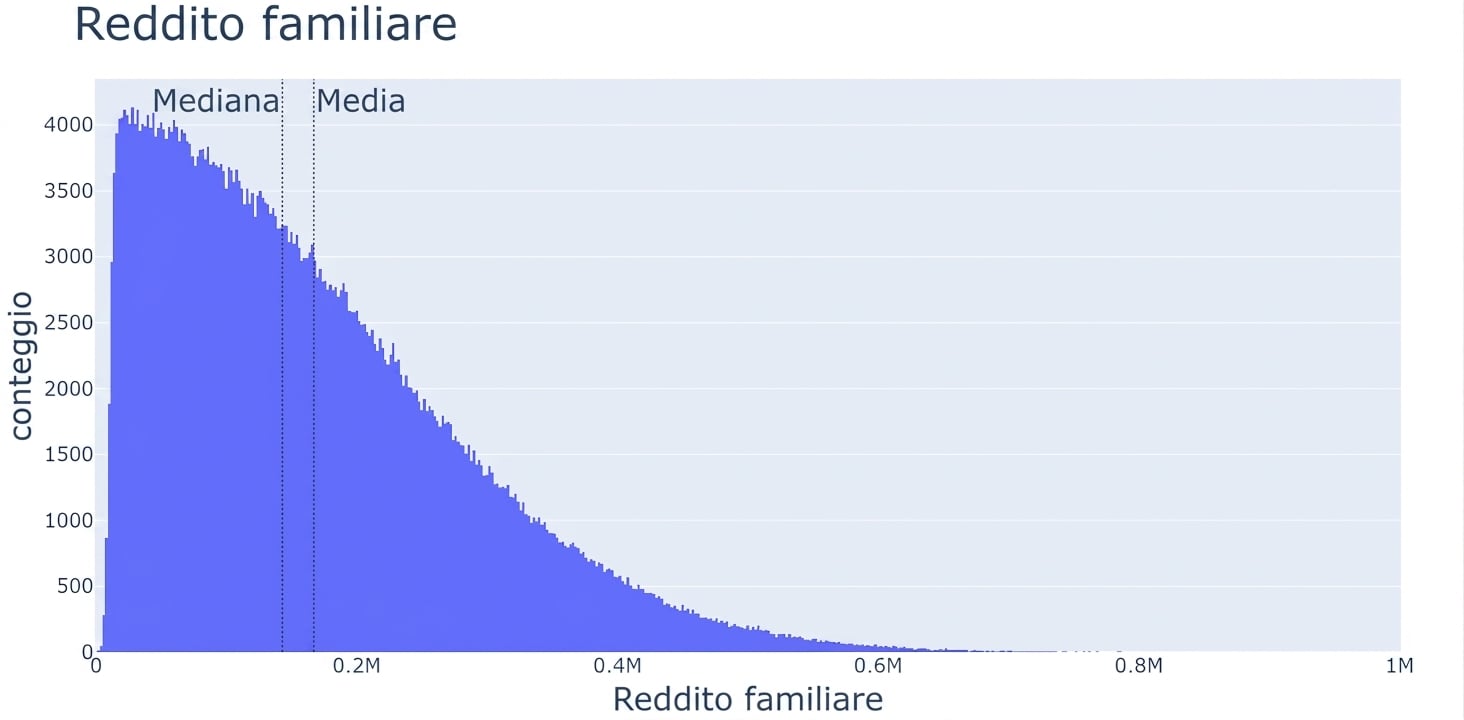
Distribuzione asimmetrica a destra
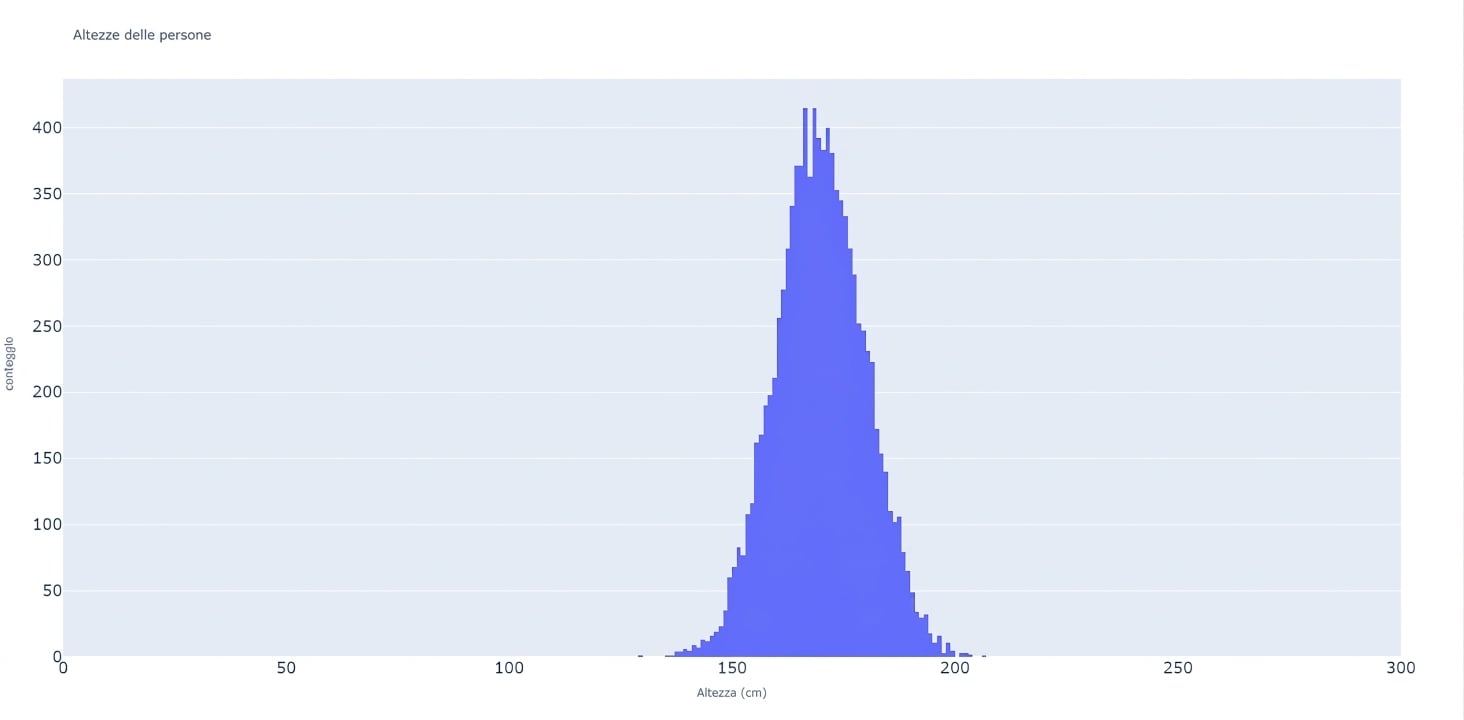
Leggere gli istogrammi - dispersione
Deviazione standard maggiore
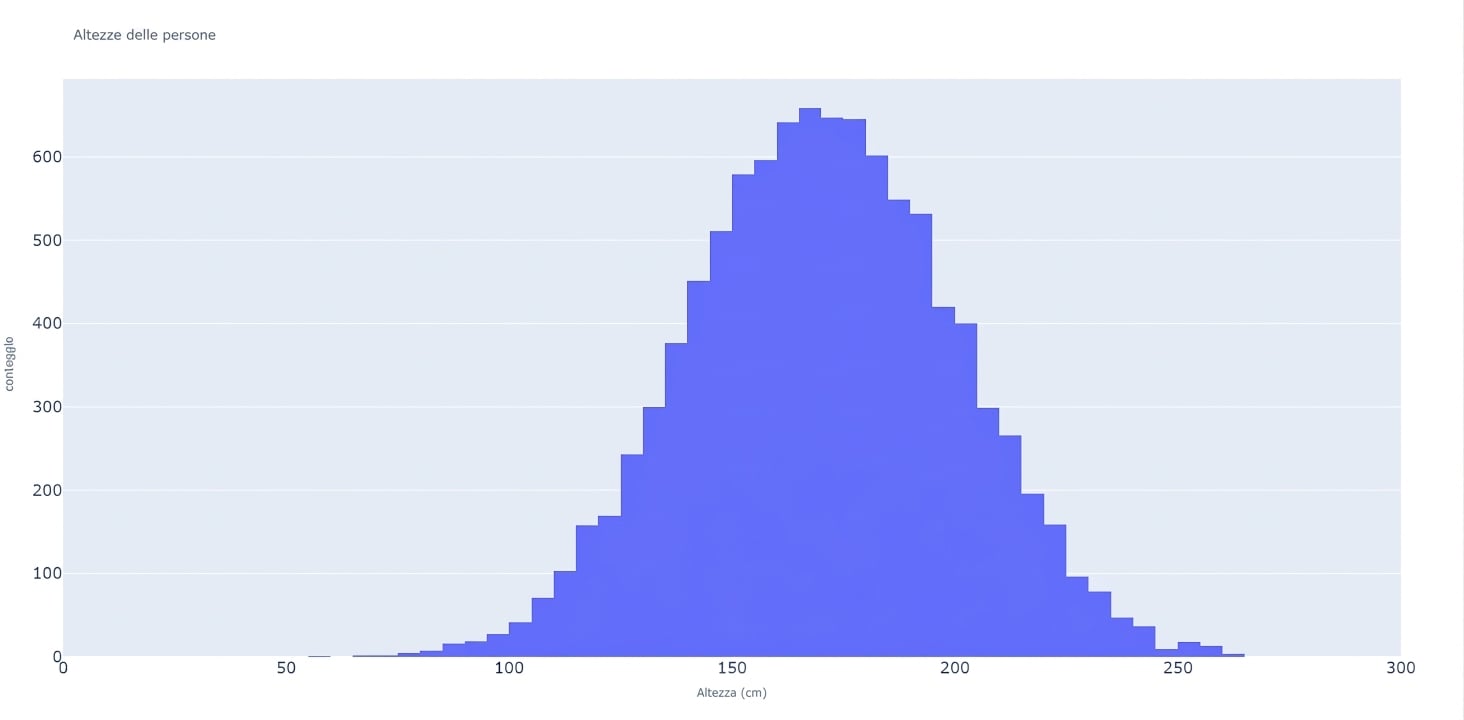
Deviazione standard minore
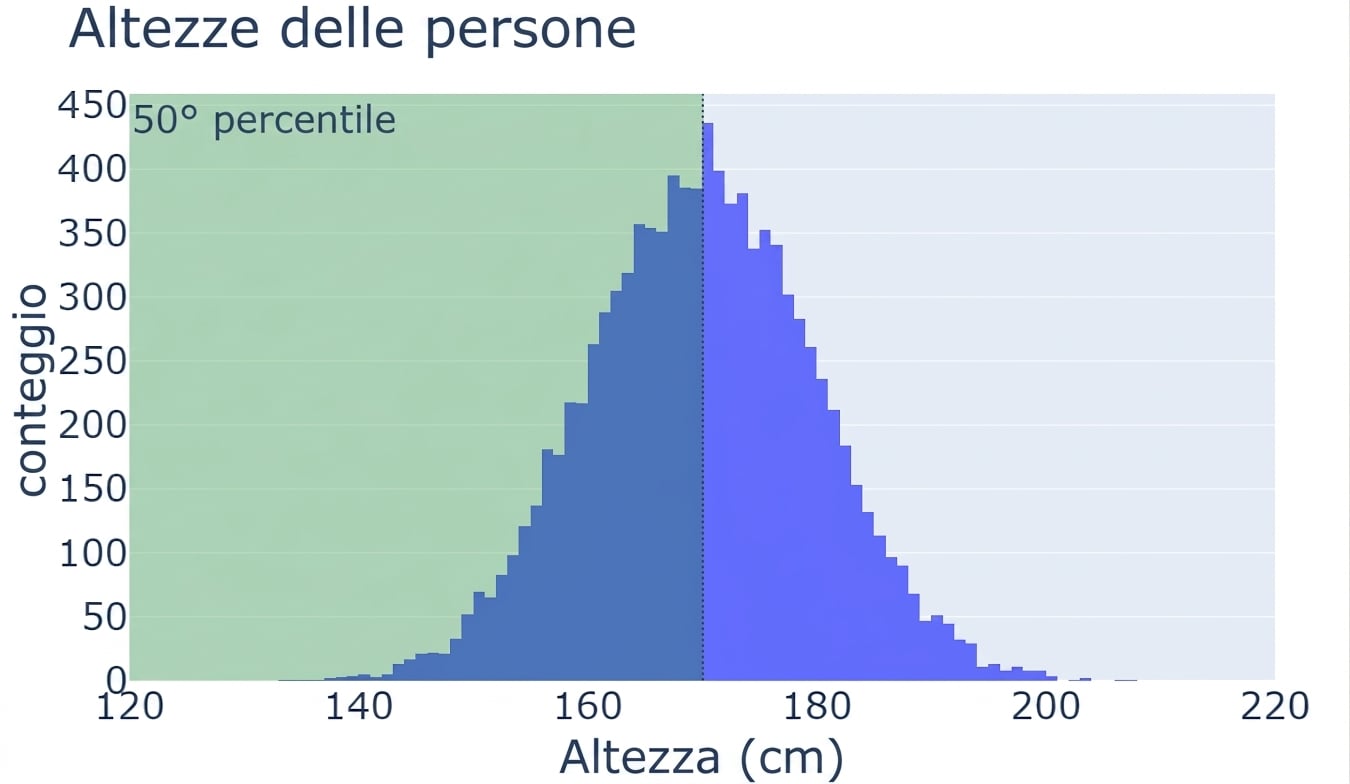
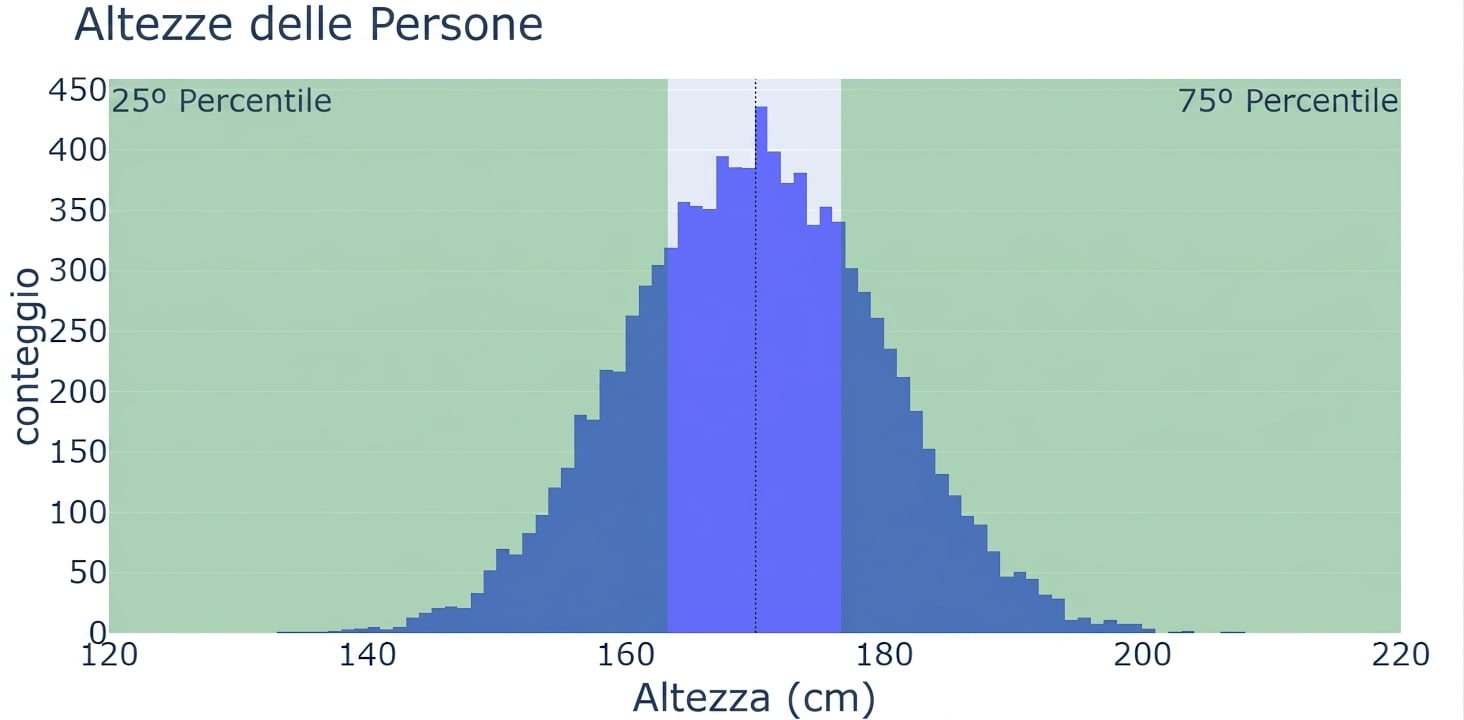
Leggere gli istogrammi - percentili
Leggere gli istogrammi - 25° e 75° percentile
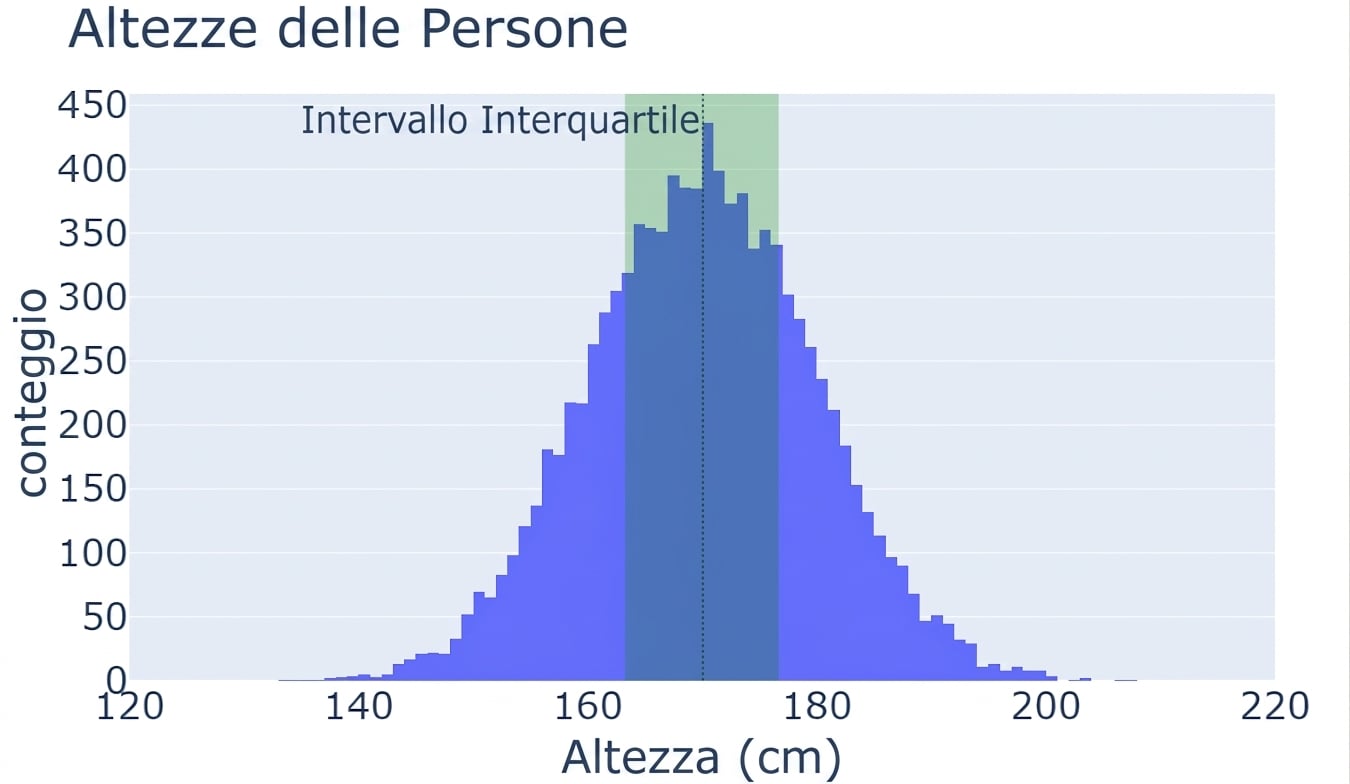
Leggere gli istogrammi - intervallo interquartile
Cos'è un outlier?