Correlazione dell'indice ed esportazione in Excel

Elaborazione di serie temporali in Python

Stefan Jansen

Founder & Lead Data Scientist at Applied Artificial Intelligence

Analisi aggiuntiva del tuo indice

  • Correlazioni dei rendimenti giornalieri:

  • Calcolale tra tutti i componenti

  • Visualizza il risultato come heatmap

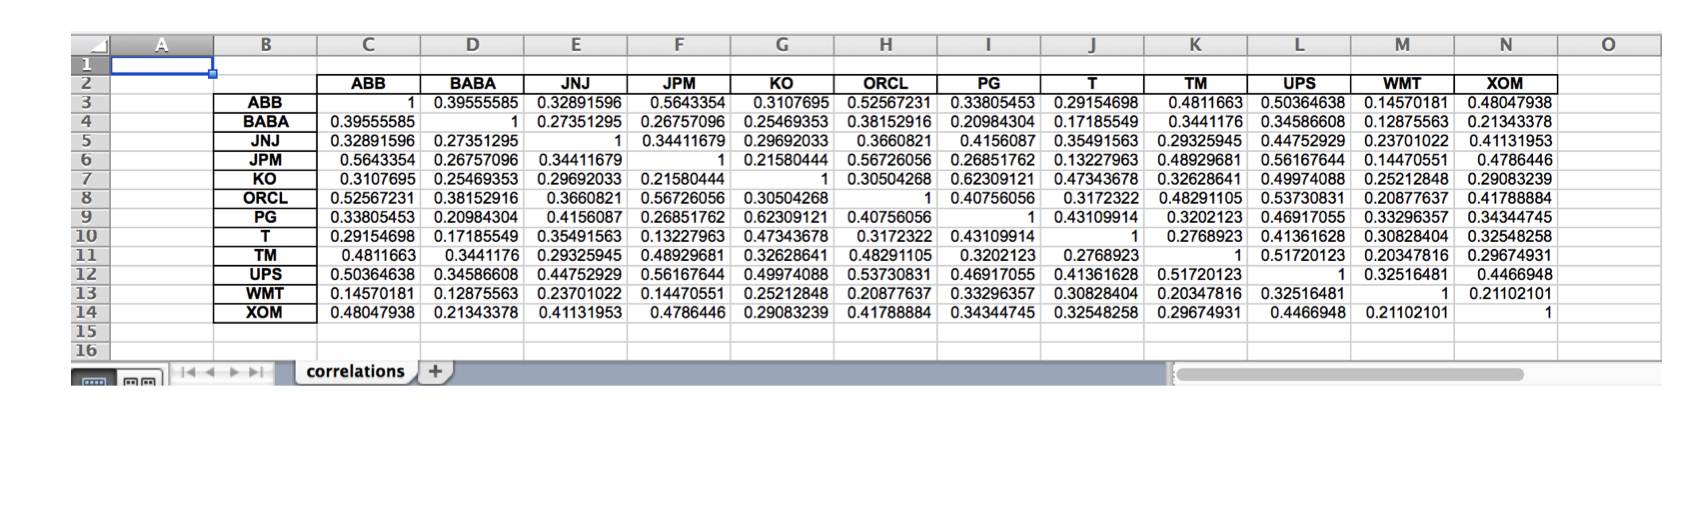
  • Scrivi i risultati in Excel nei formati .xls e .xlsx:

  • Un singolo foglio

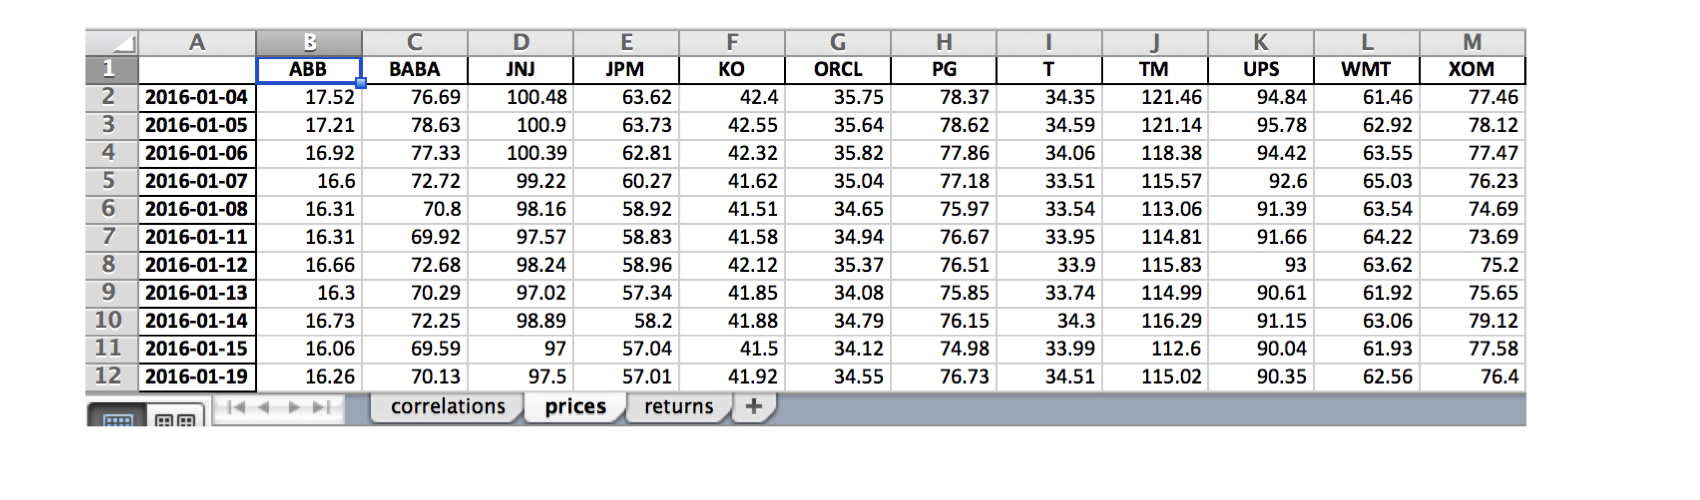
  • Più fogli

Elaborazione di serie temporali in Python

Componenti dell'indice - dati di prezzo

data = DataReader(tickers, 'google', start='2016', end='2017')['Close']

data.info()
DatetimeIndex: 252 entries, 2016-01-04 to 2016-12-30
Data columns (total 12 columns):
ABB     252 non-null float64
BABA    252 non-null float64
JNJ     252 non-null float64
JPM     252 non-null float64
KO      252 non-null float64
ORCL    252 non-null float64
PG      252 non-null float64
T       252 non-null float64
TM      252 non-null float64
UPS     252 non-null float64
WMT     252 non-null float64
XOM     252 non-null float64
Elaborazione di serie temporali in Python

Componenti dell'indice: correlazioni dei rendimenti

daily_returns = data.pct_change()

correlations = daily_returns.corr()
ABB  BABA  JNJ  JPM   KO  ORCL   PG    T   TM  UPS  WMT  XOM
ABB  1.00  0.40 0.33 0.56 0.31  0.53 0.34 0.29 0.48 0.50 0.15 0.48
BABA 0.40  1.00 0.27 0.27 0.25  0.38 0.21 0.17 0.34 0.35 0.13 0.21
JNJ  0.33  0.27 1.00 0.34 0.30  0.37 0.42 0.35 0.29 0.45 0.24 0.41
JPM  0.56  0.27 0.34 1.00 0.22  0.57 0.27 0.13 0.49 0.56 0.14 0.48
KO   0.31  0.25 0.30 0.22 1.00  0.31 0.62 0.47 0.33 0.50 0.25 0.29
ORCL 0.53  0.38 0.37 0.57 0.31  1.00 0.41 0.32 0.48 0.54 0.21 0.42
PG   0.34  0.21 0.42 0.27 0.62  0.41 1.00 0.43 0.32 0.47 0.33 0.34
T    0.29  0.17 0.35 0.13 0.47  0.32 0.43 1.00 0.28 0.41 0.31 0.33
TM   0.48  0.34 0.29 0.49 0.33  0.48 0.32 0.28 1.00 0.52 0.20 0.30
UPS  0.50  0.35 0.45 0.56 0.50  0.54 0.47 0.41 0.52 1.00 0.33 0.45
WMT  0.15  0.13 0.24 0.14 0.25  0.21 0.33 0.31 0.20 0.33 1.00 0.21
XOM  0.48  0.21 0.41 0.48 0.29  0.42 0.34 0.33 0.30 0.45 0.21 1.00
Elaborazione di serie temporali in Python

Componenti dell'indice: correlazioni dei rendimenti

sns.heatmap(correlations, annot=True)
plt.xticks(rotation=45)
plt.title('Daily Return Correlations')
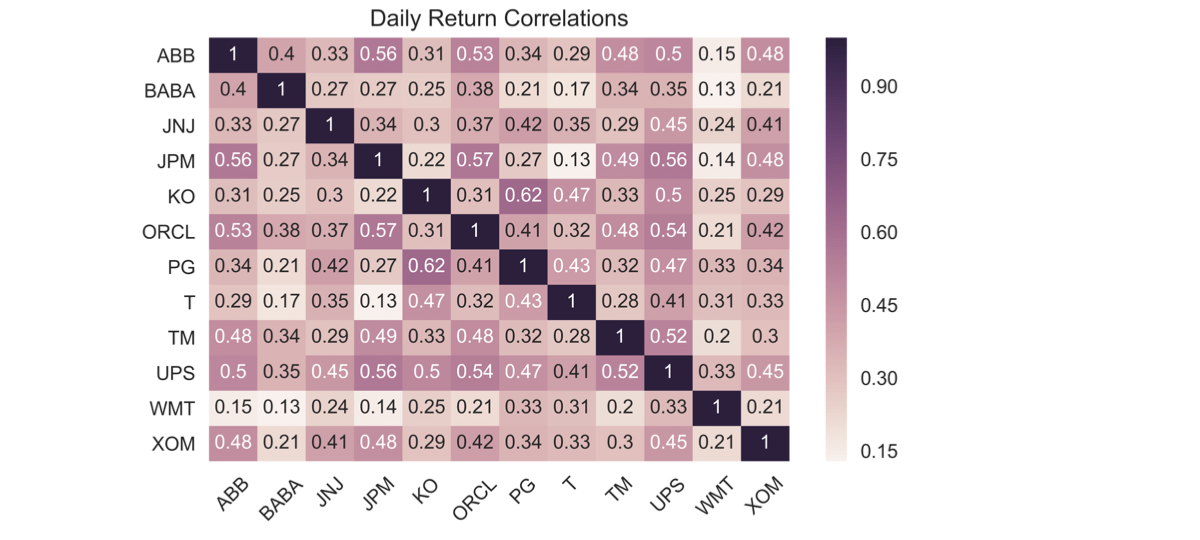
ch4_4_v2 - Index Correlation & Saving Results to Excel.010.png

Elaborazione di serie temporali in Python

Salvataggio in un singolo foglio Excel

correlations.to_excel(excel_writer= 'correlations.xls',
                      sheet_name='correlations',
                      startrow=1,
                      startcol=1)
ch4_4_v2 - Index Correlation & Saving Results to Excel.012.png

Elaborazione di serie temporali in Python

Salvataggio in più fogli Excel

data.index = data.index.date # Keep only date component

with pd.ExcelWriter('stock_data.xlsx') as writer:
corr.to_excel(excel_writer=writer, sheet_name='correlations')
data.to_excel(excel_writer=writer, sheet_name='prices')
data.pct_change().to_excel(writer, sheet_name='returns')
ch4_4_v2 - Index Correlation & Saving Results to Excel.015.png

Elaborazione di serie temporali in Python

Esercitiamoci!

Elaborazione di serie temporali in Python

Preparing Video For Download...