Özniteliklerin kullanımı
ggplot2 ile Veri Görselleştirmeye Giriş

Rick Scavetta
Founder, Scavetta Academy
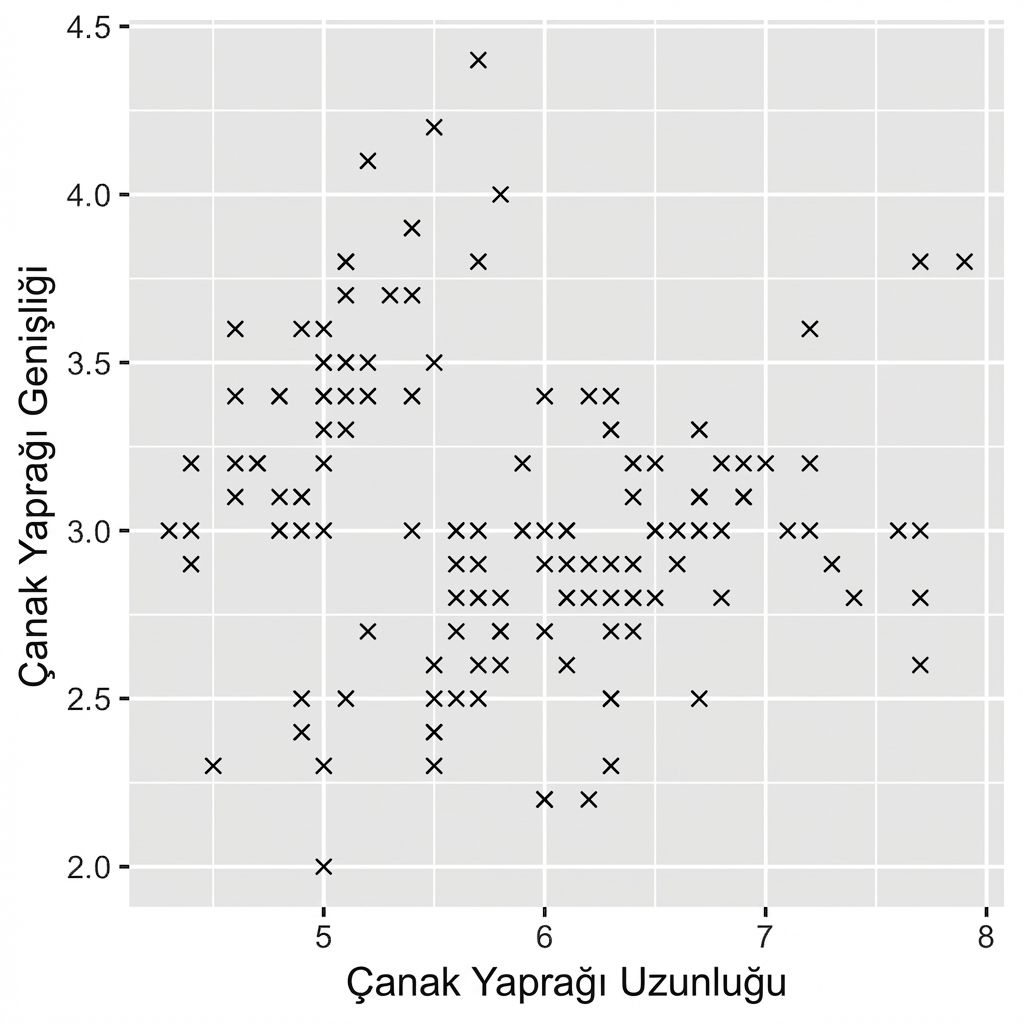
Estetikler mi? Öznitelikler!
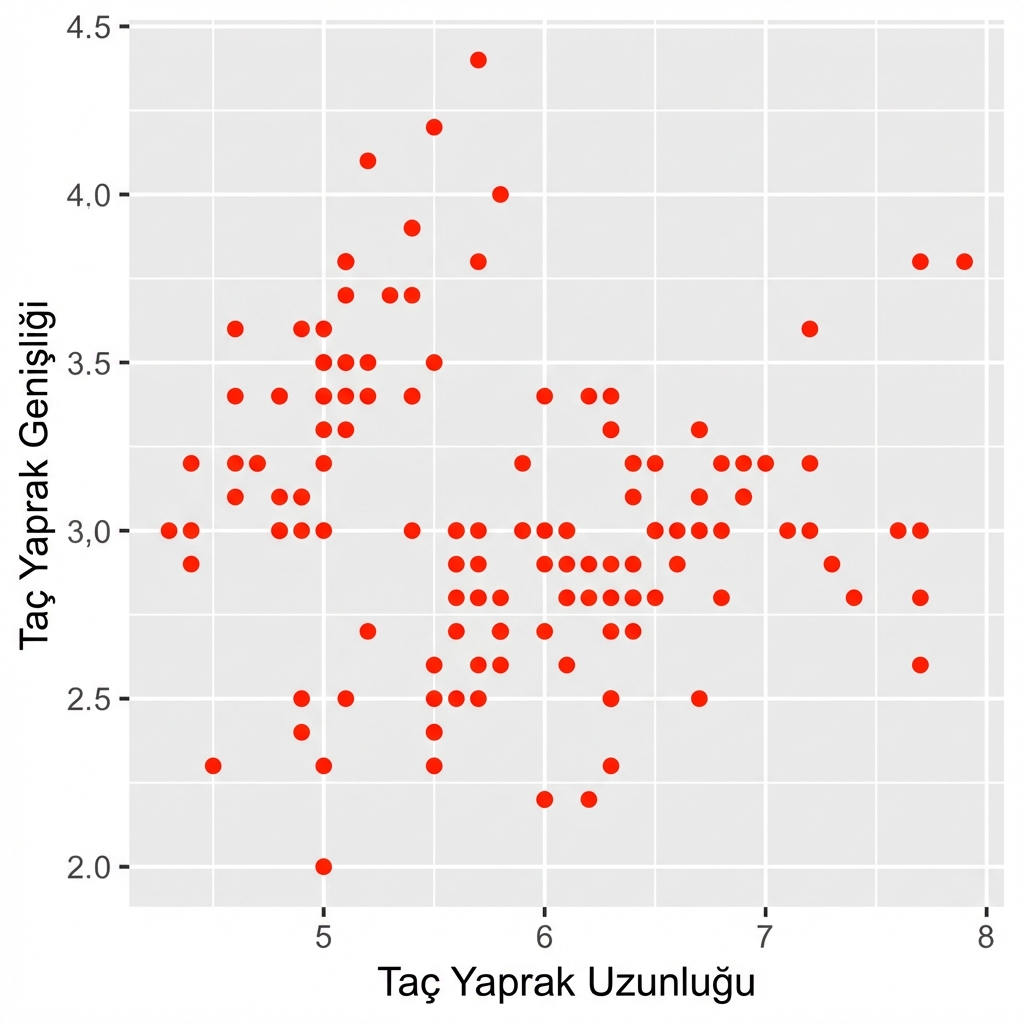
Estetikler mi? Öznitelikler!
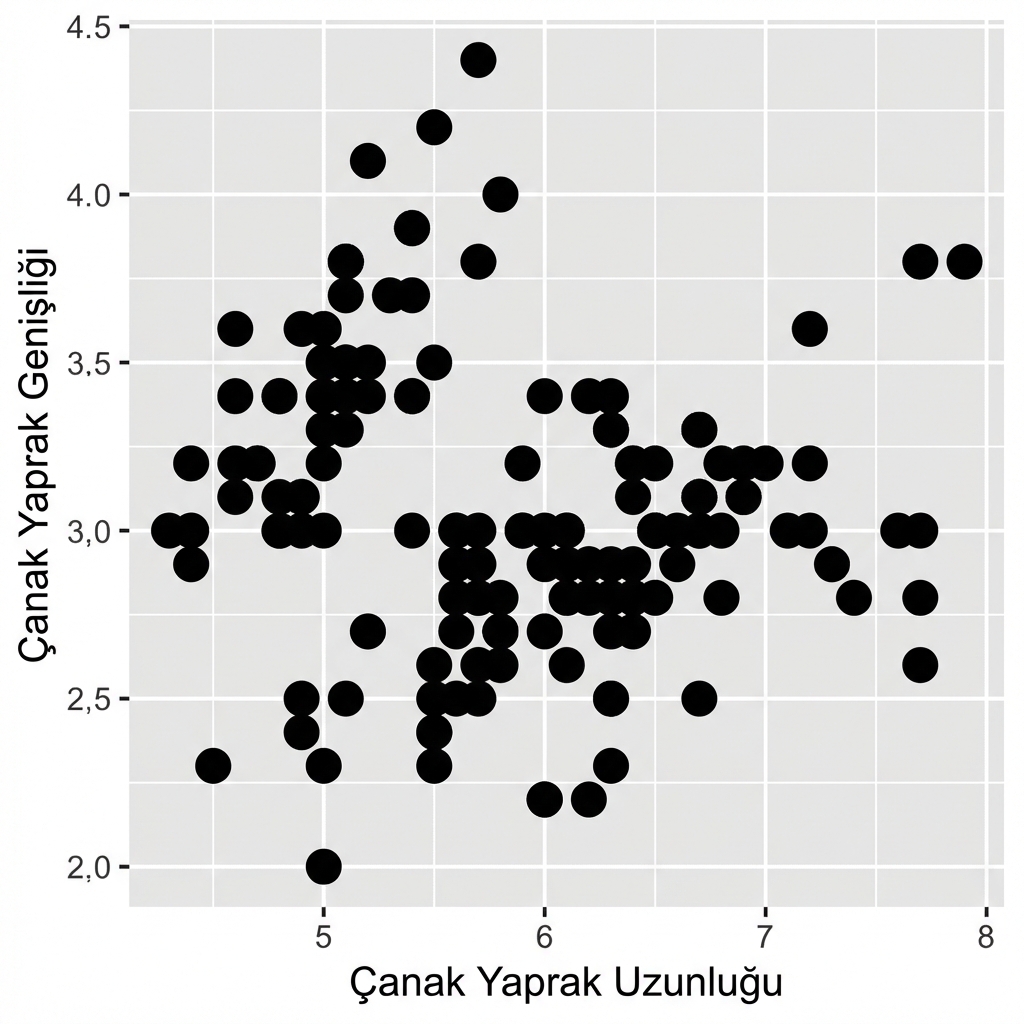
Estetikler mi? Öznitelikler!
ggplot2 ile Veri Görselleştirmeye Giriş
Rick Scavetta
Founder, Scavetta Academy

