Saçılım grafikleri
ggplot2 ile Veri Görselleştirmeye Giriş

Rick Scavetta
Founder, Scavetta Academy
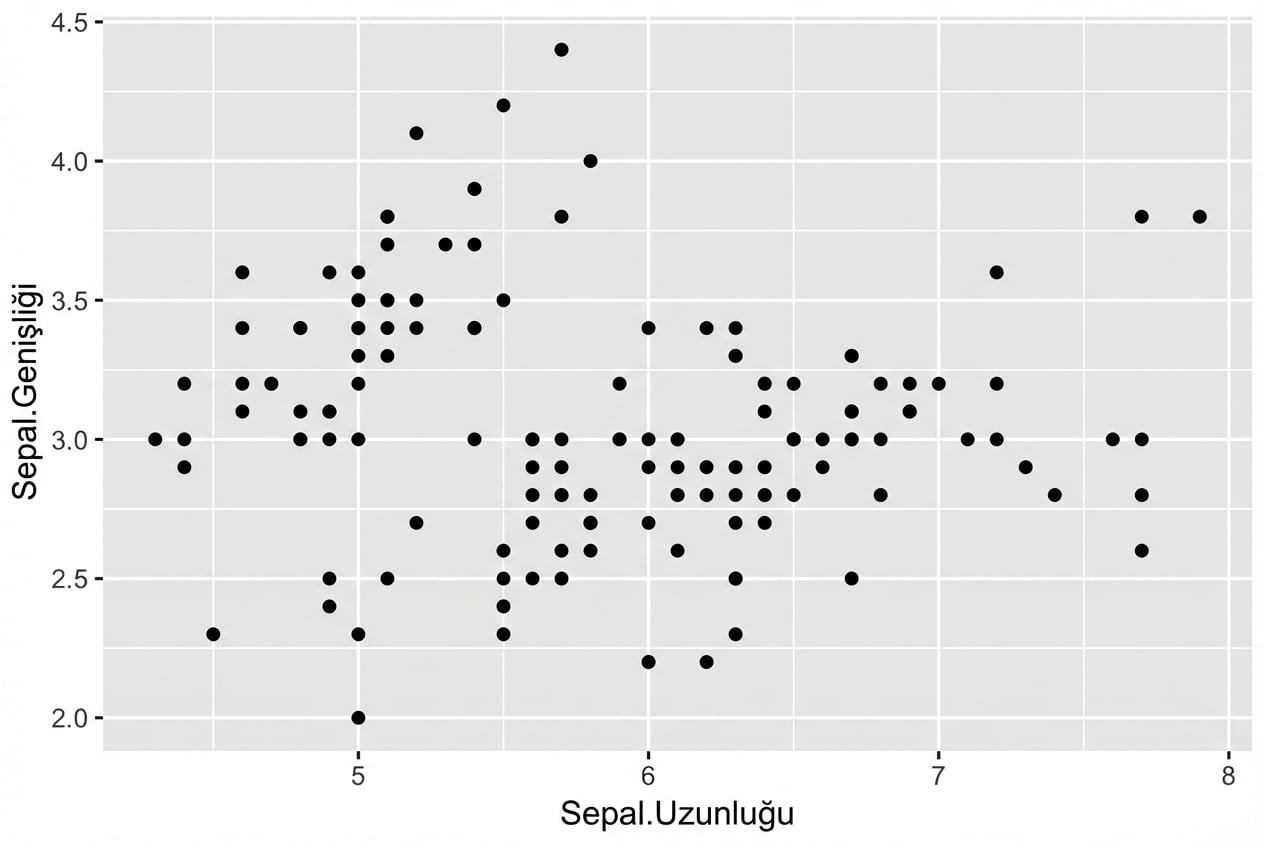
Saçılım grafikleri
ggplot(iris, aes(x = Sepal.Length,
                 y = Sepal.Width)) +
  geom_point()
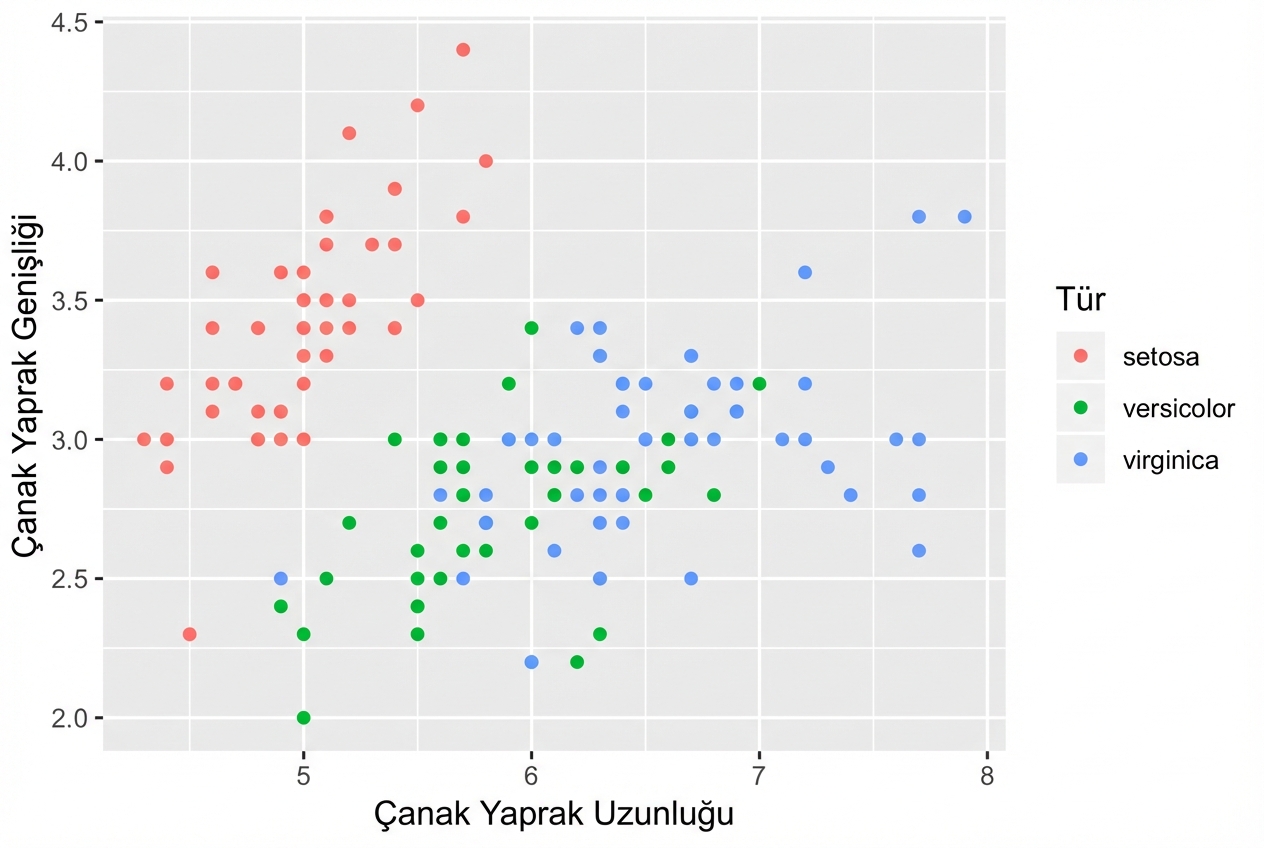
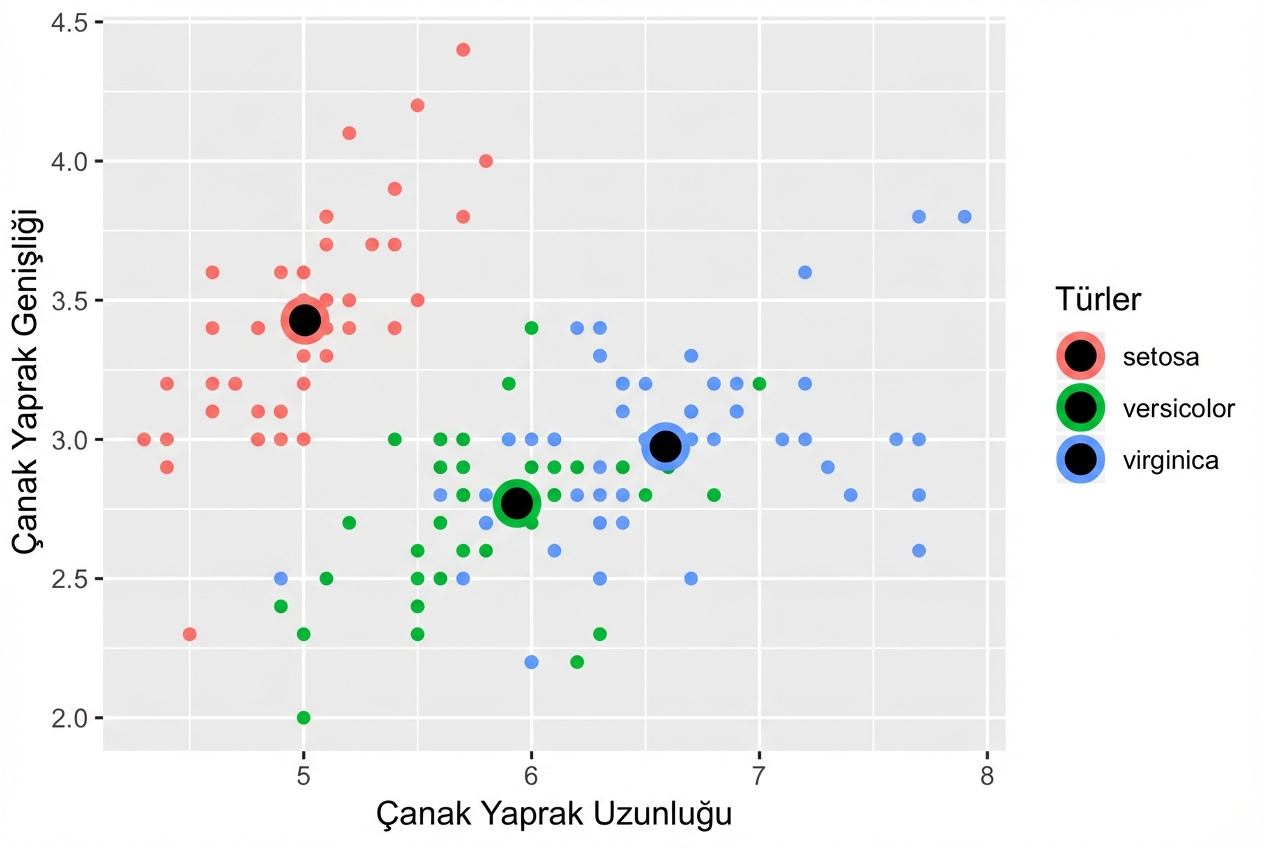
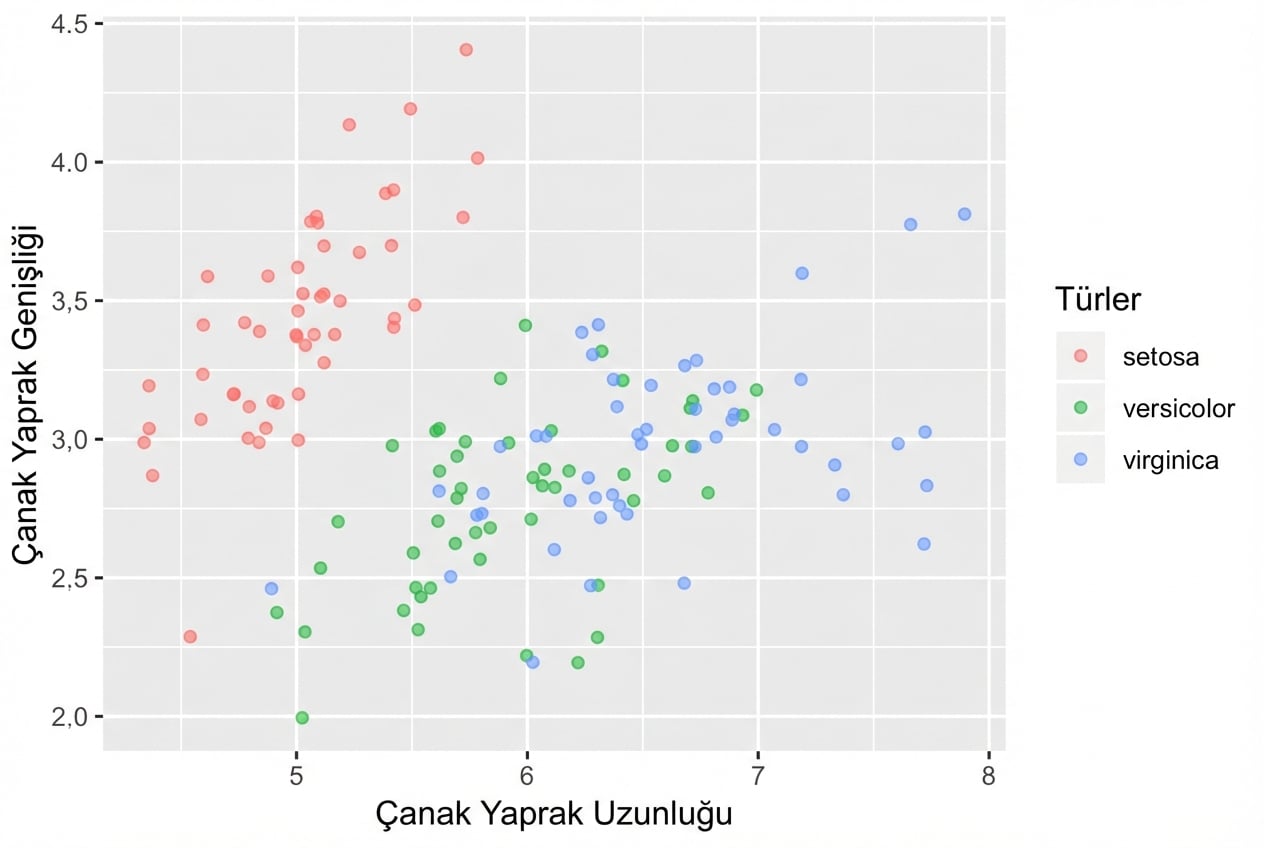
Saçılım grafikleri
ggplot(iris, aes(x = Sepal.Length,
                 y = Sepal.Width,
                 col = Species)) +
  geom_point()
Geom’a özgü estetik eşlemeler
# Bunlar aynı grafiği üretir!
ggplot(iris, aes(x = Sepal.Length, y = Sepal.Width, col = Species)) +
  geom_point()

ggplot(iris, aes(x = Sepal.Length, y = Sepal.Width)) +
  geom_point(aes(col = Species))
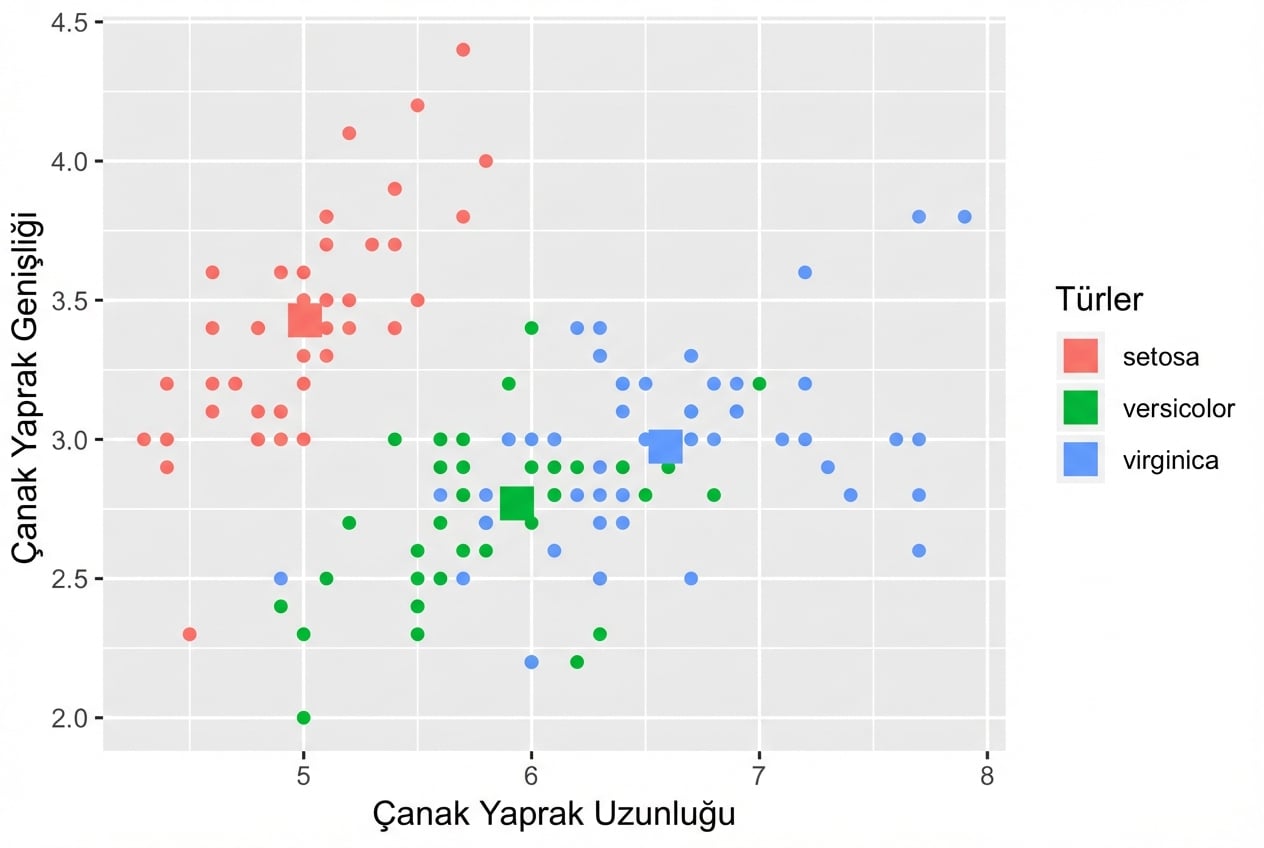
Her katmanın estetik eşlemelerini bağımsız kontrol edin:
ggplot(iris, aes(x = Sepal.Length, y = Sepal.Width, col = Species)) +
  # Hem veriyi hem aes'i ggplot()'tan devralır
  geom_point() +
  # Farklı veri, fakat devralınan aes
  geom_point(data = iris.summary, shape = 15, size = 5)
Şekil özniteliği değerleri
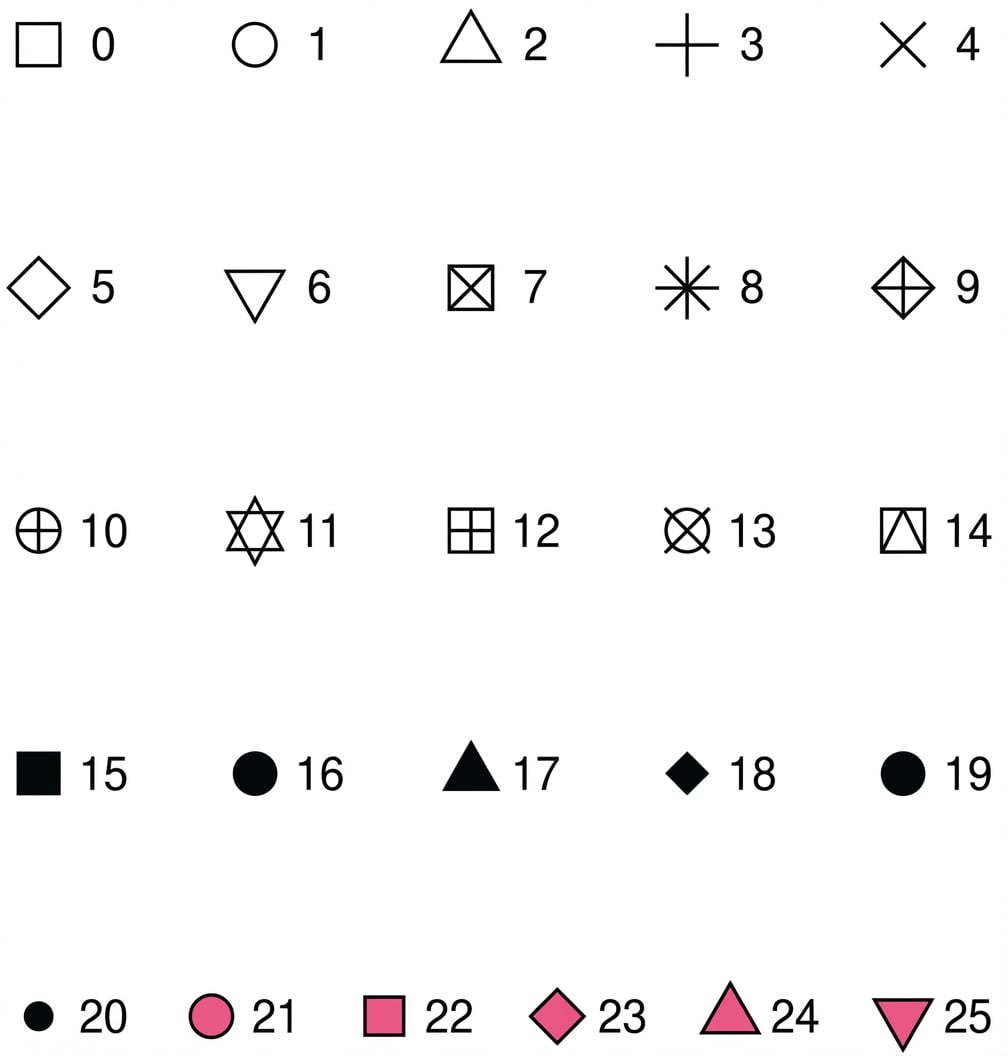
Örnek
ggplot(iris, aes(x = Sepal.Length, y = Sepal.Width, col = Species)) +
  geom_point() +
  geom_point(data = iris.summary, shape = 21, size = 5,
             fill = "black", stroke = 2)
ggplot2 ile anlık istatistikler
- İstatistik katmanı için ikinci derse bakınız.
- Not: Sadece ortalamayı, yayılım ölçüsü olmadan (ör. standart sapma) çizmekten kaçınınız.
position = "jitter"
ggplot(iris, aes(x = Sepal.Length, y = Sepal.Width, col = Species)) +
  geom_point(position = "jitter")
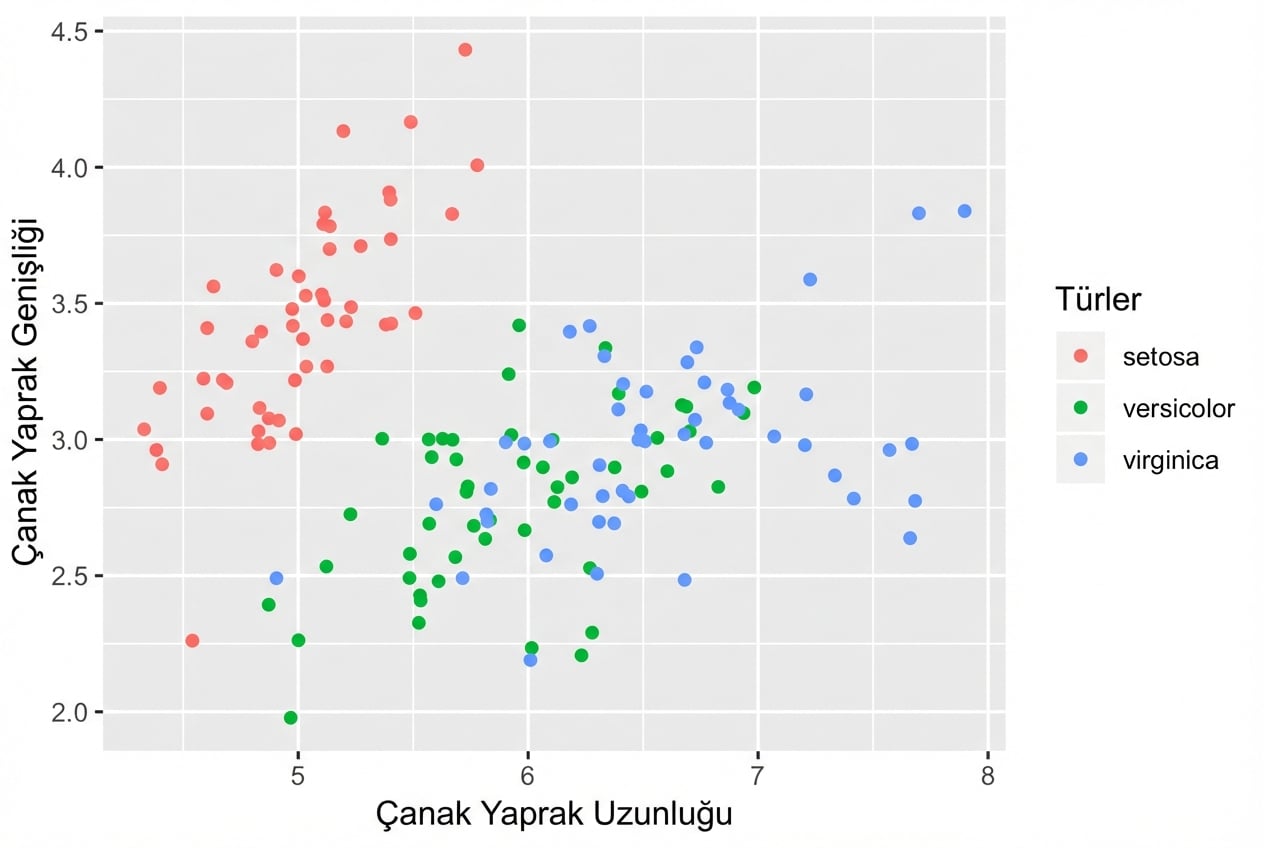
geom_jitter()
geom_point(position = "jitter") için kısayol
ggplot(iris, aes(x = Sepal.Length, y = Sepal.Width, col = Species)) +
  geom_jitter()
Alfa’yı ayarlamayı unutmayın
- Gerekirse jitter ile alfa harmanlamayı birleştiriniz
ggplot(iris, aes(x = Sepal.Length, y = Sepal.Width, col = Species)) +
  geom_jitter(alpha = 0.6)
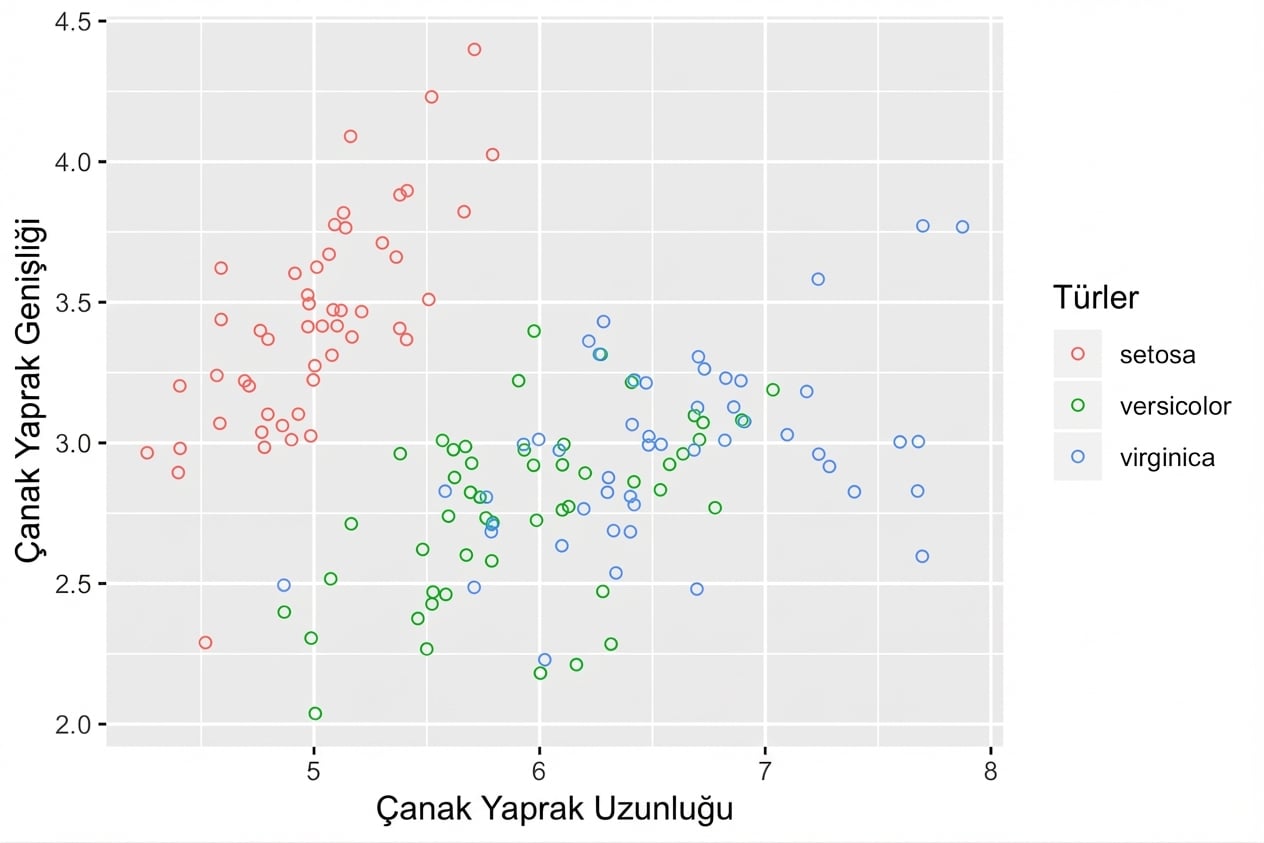
İçi boş daireler de işe yarar
shape = 1içi boş dairedir.- Alfa harmanlama kullanmanız gerekmez.
ggplot(iris, aes(x = Sepal.Length, y = Sepal.Width, col = Species)) +
  geom_jitter(shape = 1)