Estetik için en iyi uygulamalar
ggplot2 ile Veri Görselleştirmeye Giriş

Rick Scavetta
Founder, Scavetta Academy
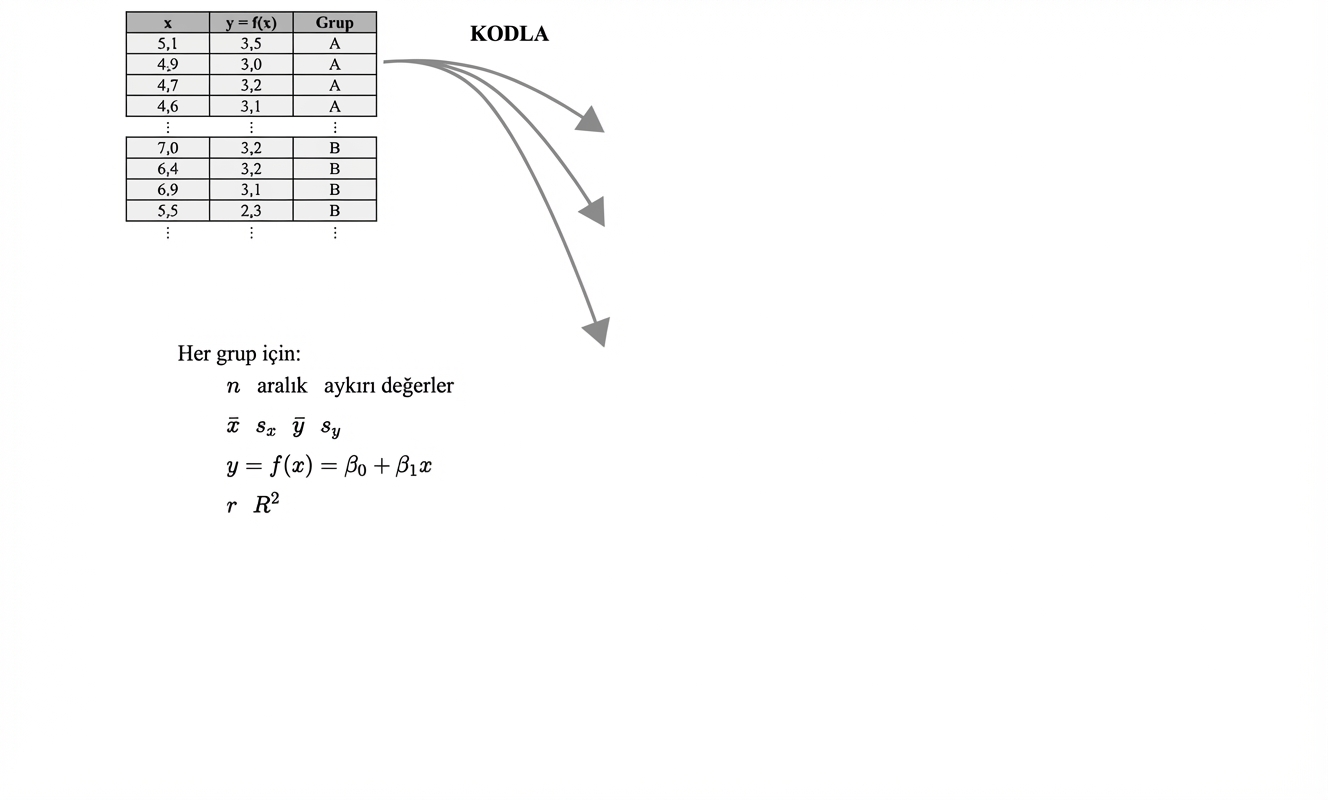
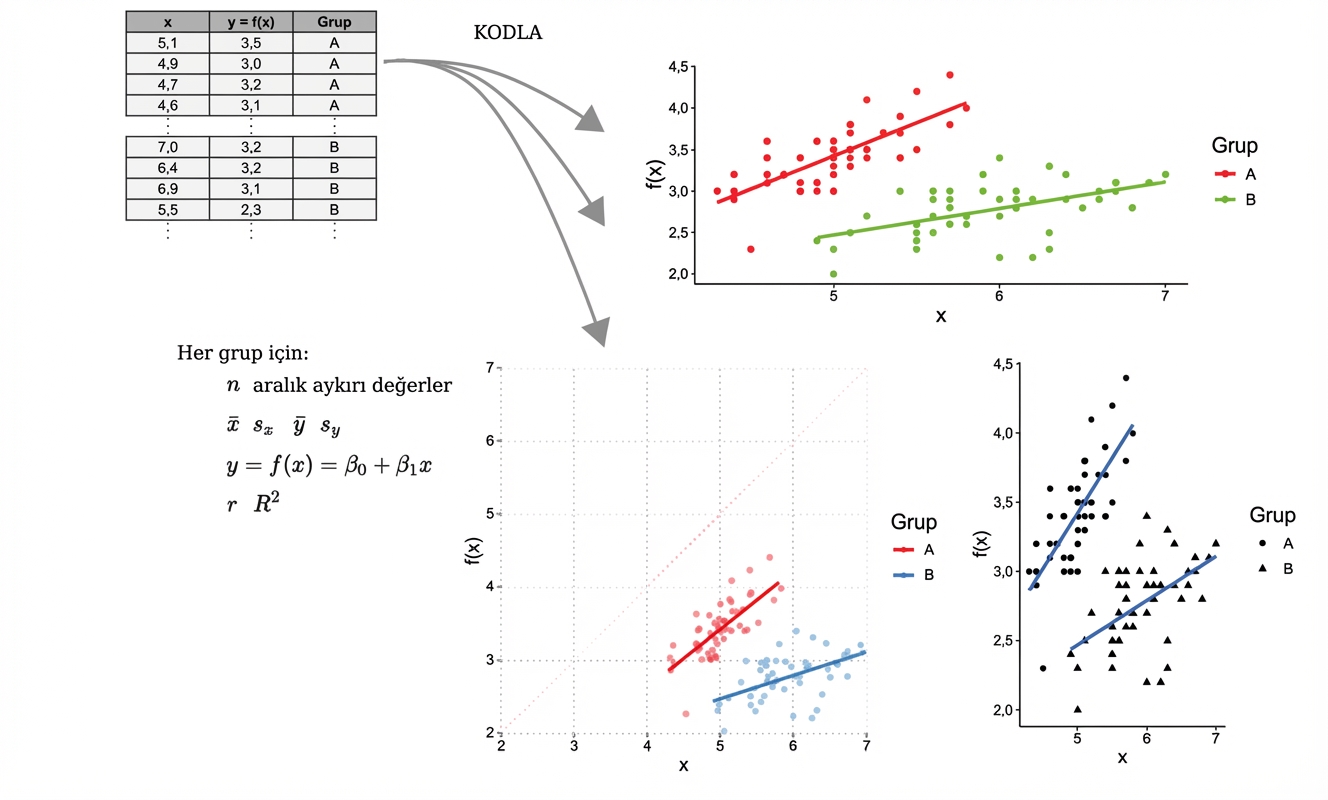
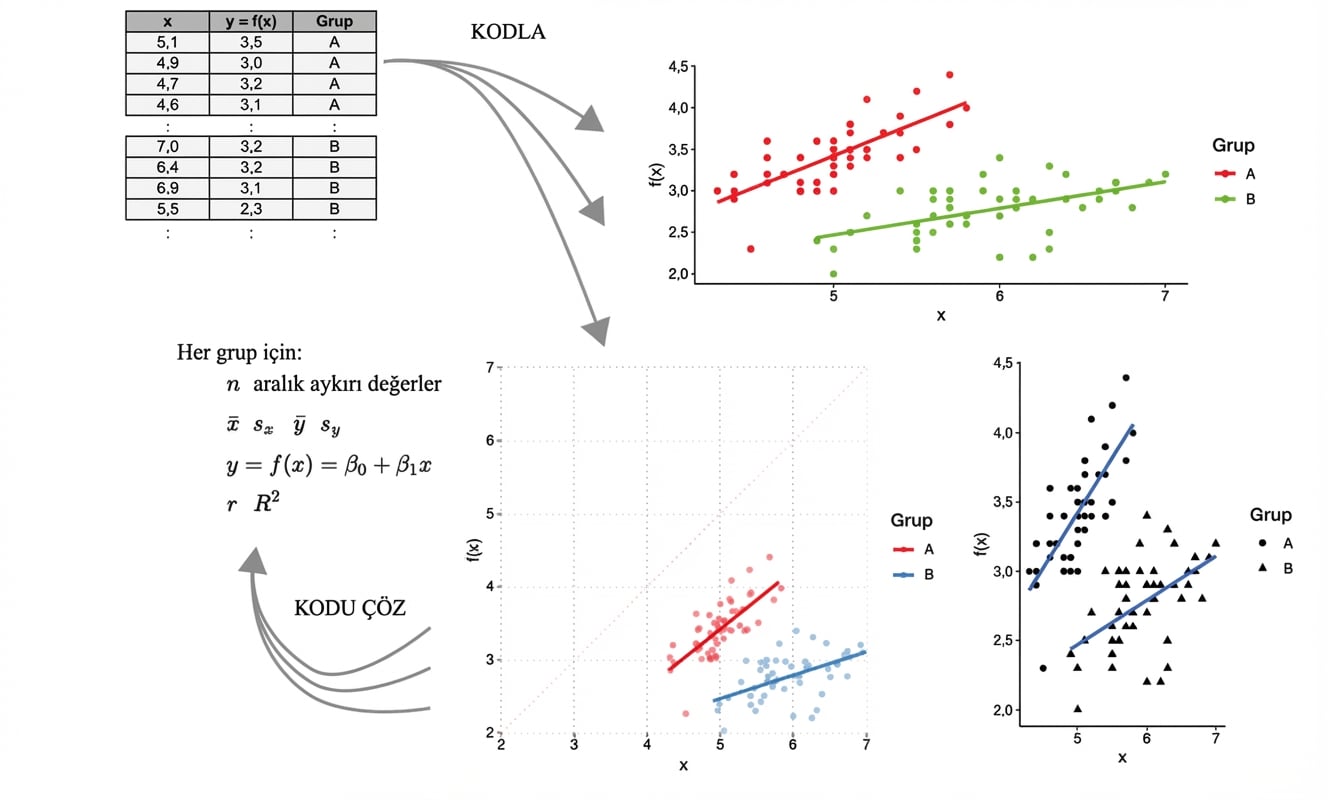
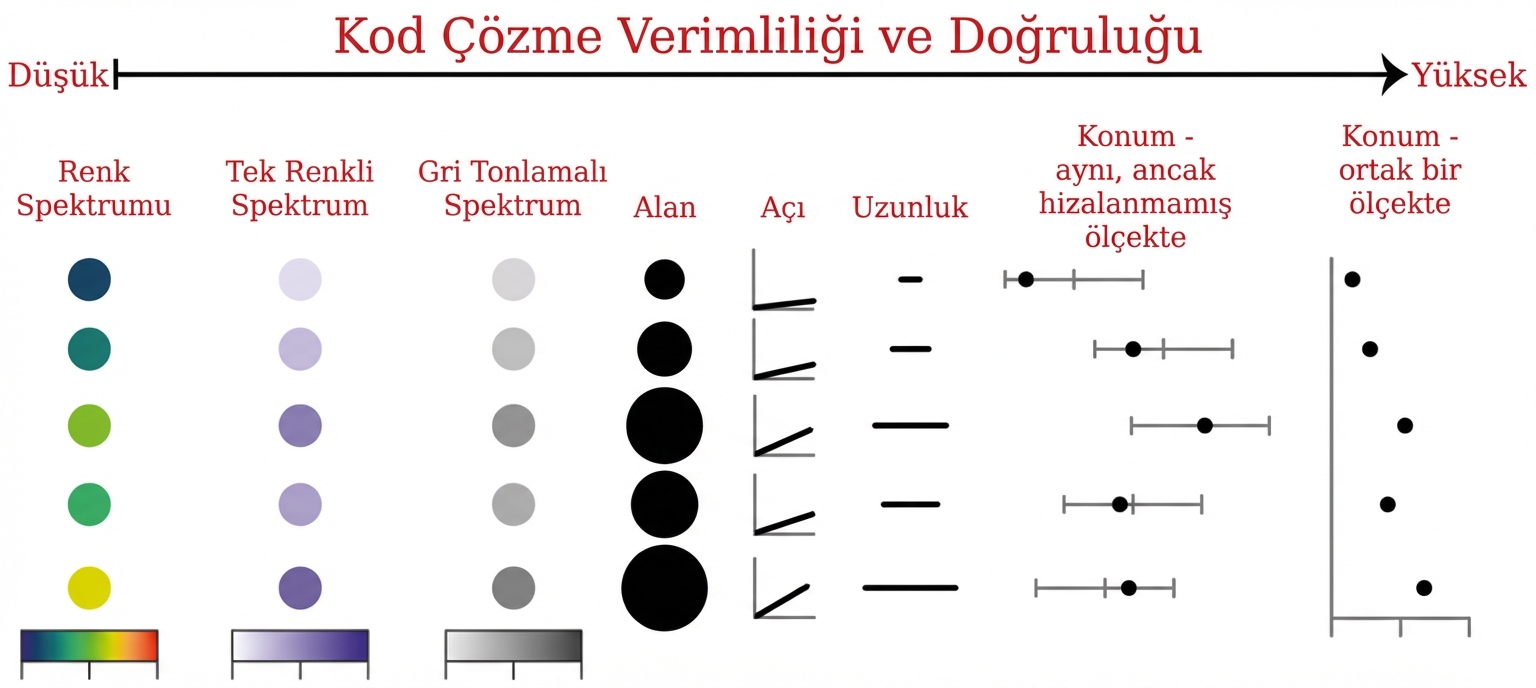
Biçim işlevi izler
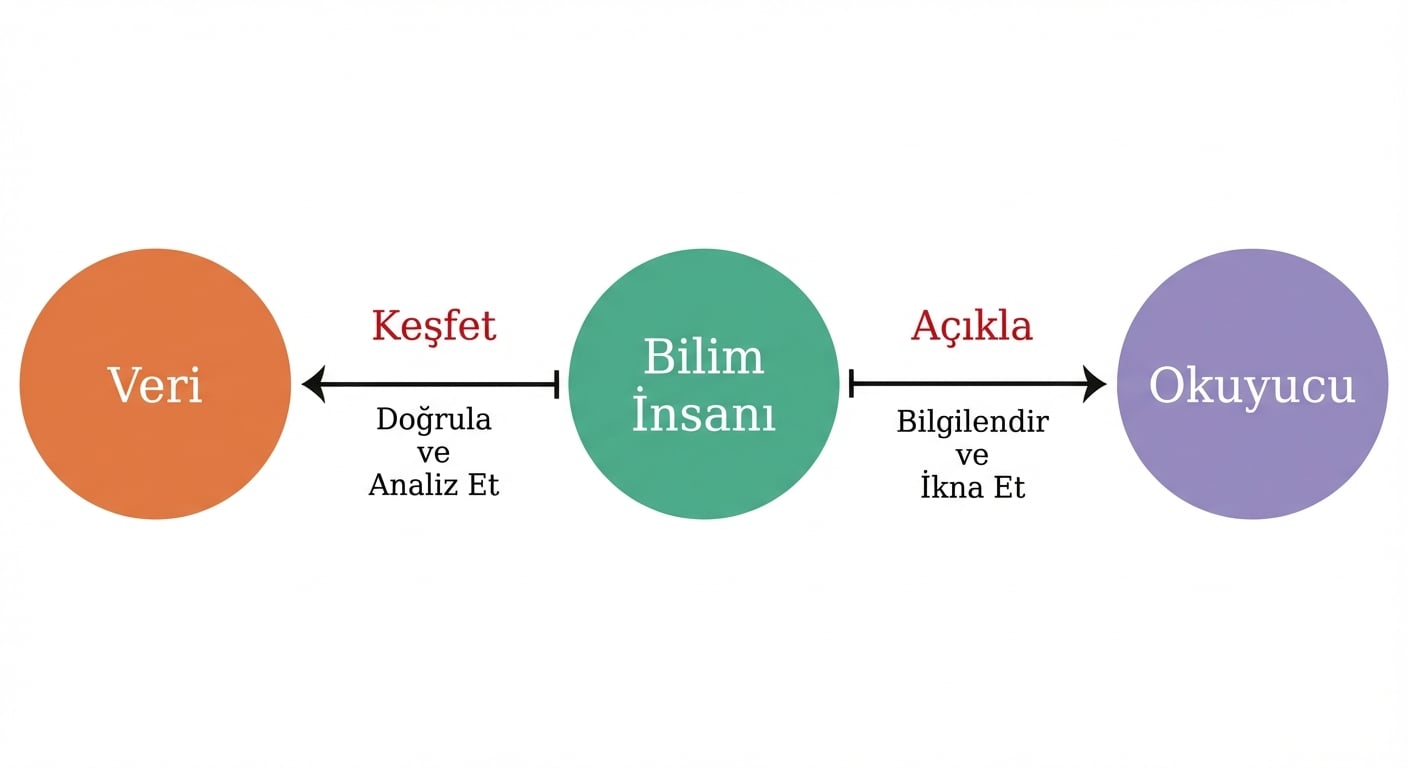
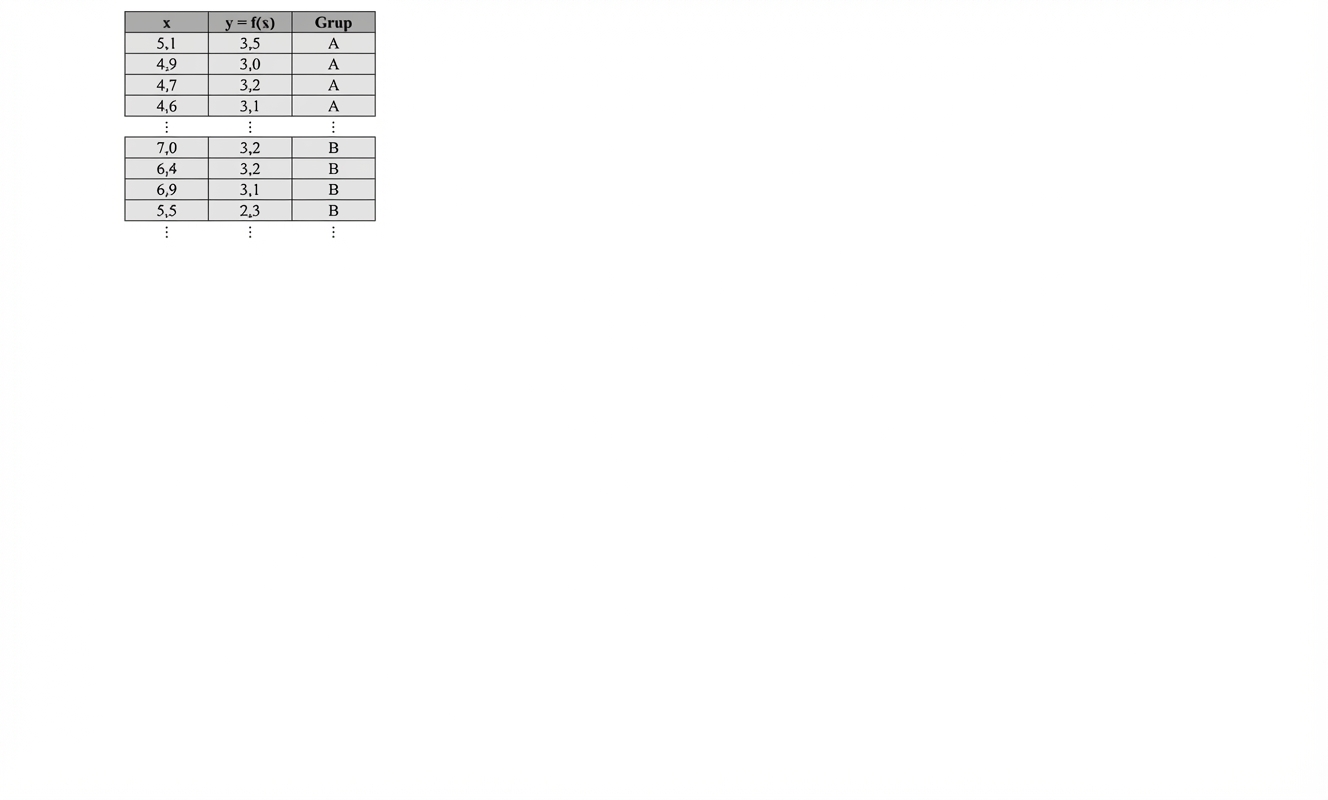
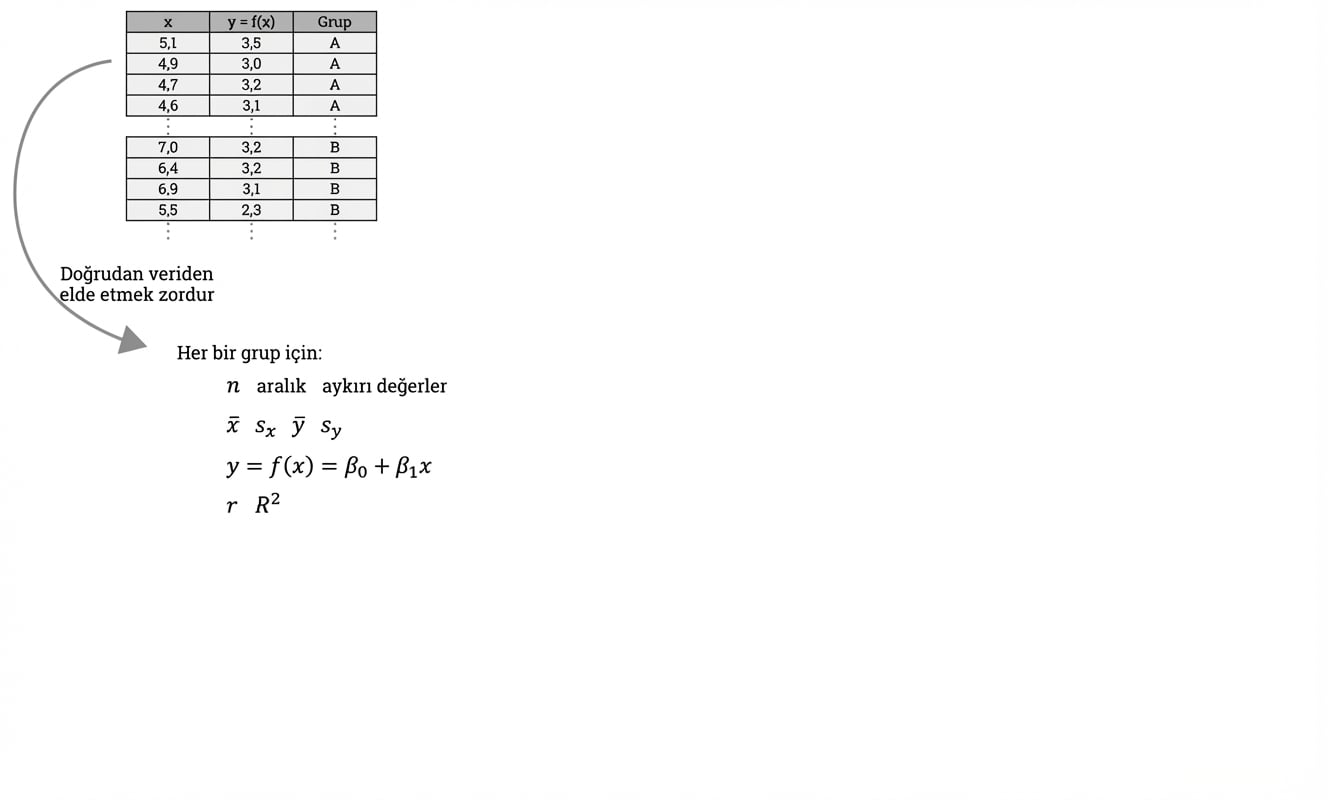
Veriden bilgi çıkarma

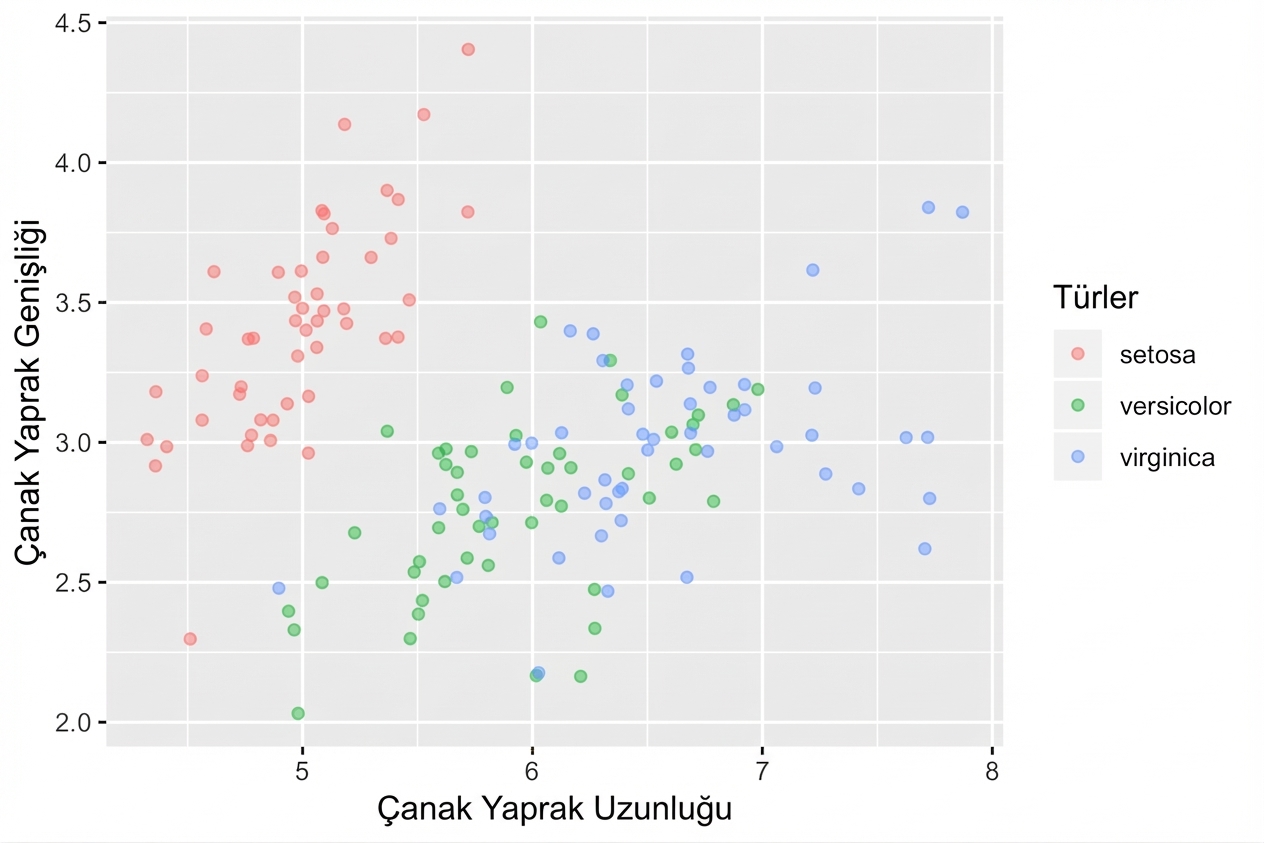
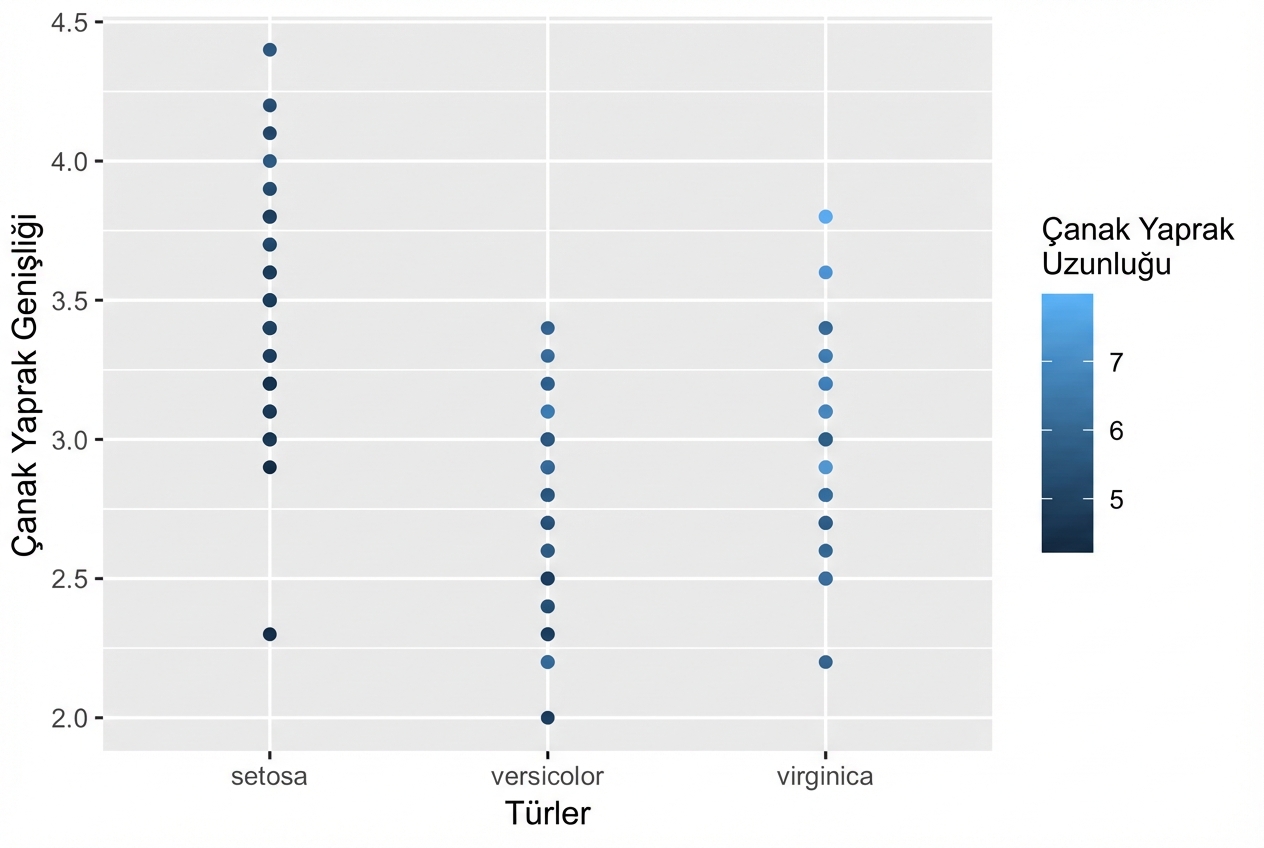
Estetik - sürekli değişkenler
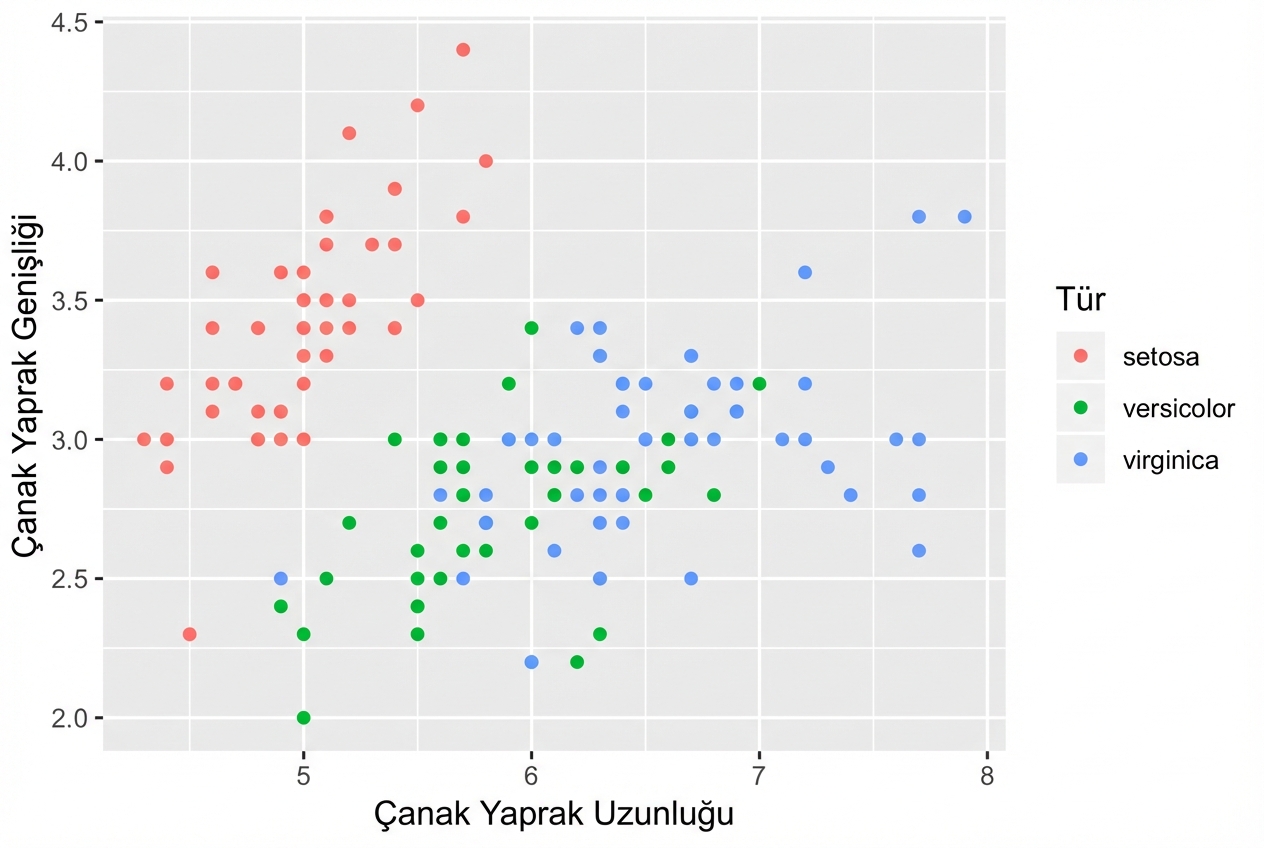
Estetik - sürekli değişkenler
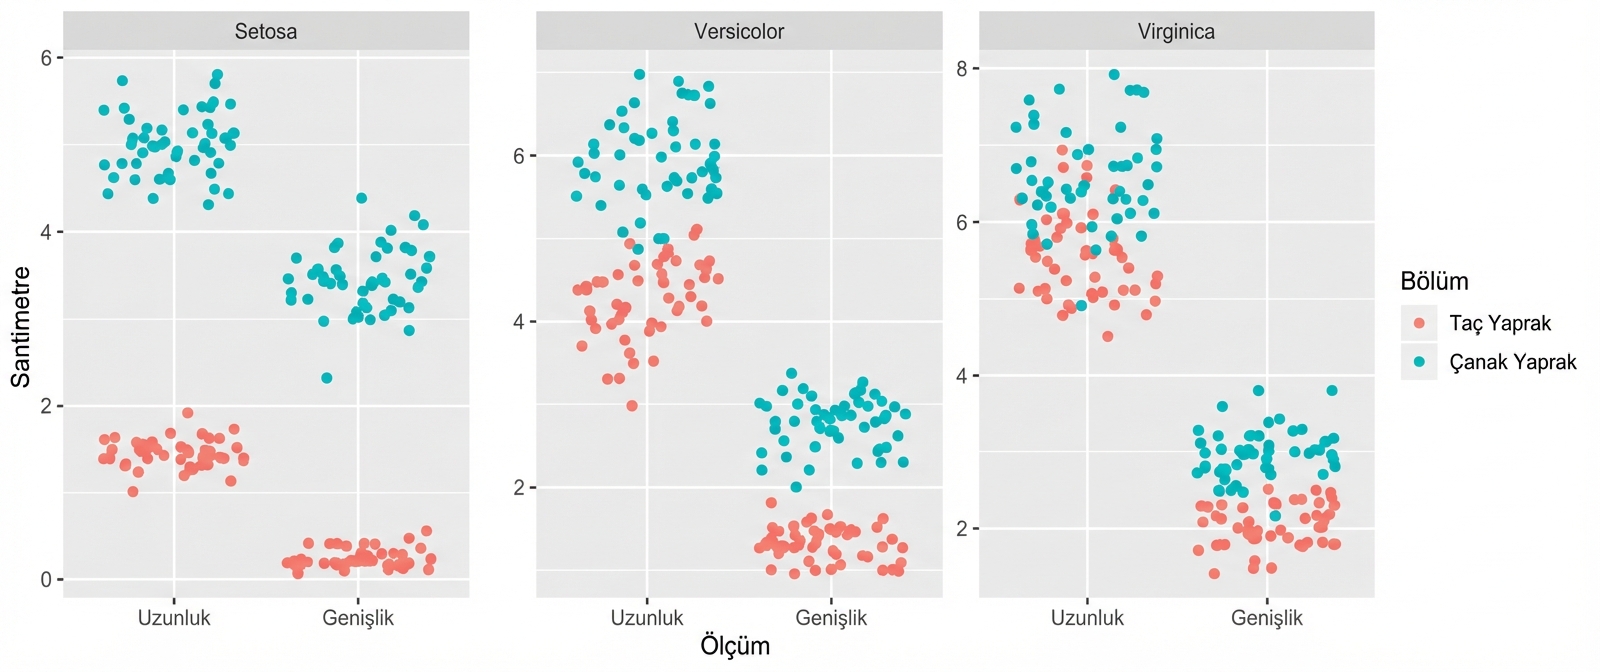
Üç iris saçılım grafiği
Üç iris saçılım grafiği, hizasız y eksenleri
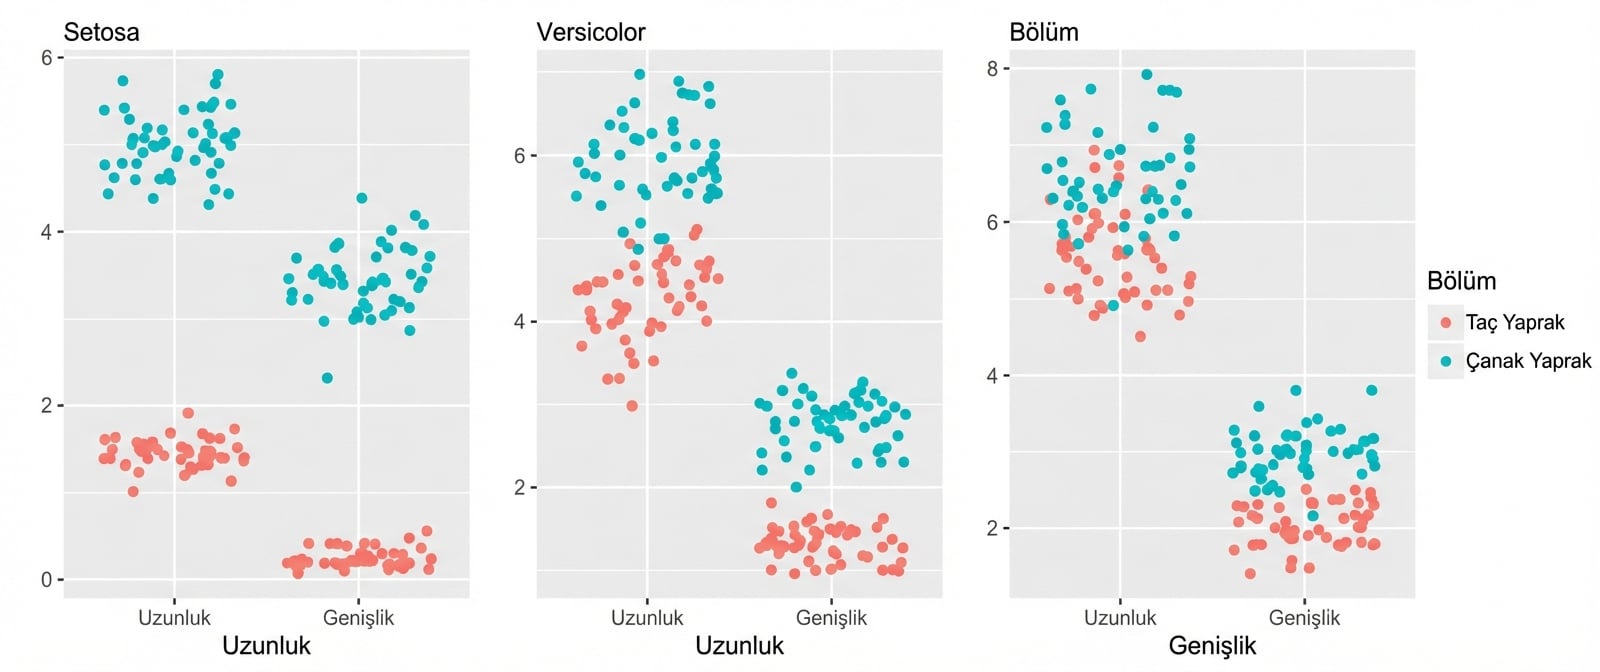
Tek fasetli grafik, ortak y ekseni
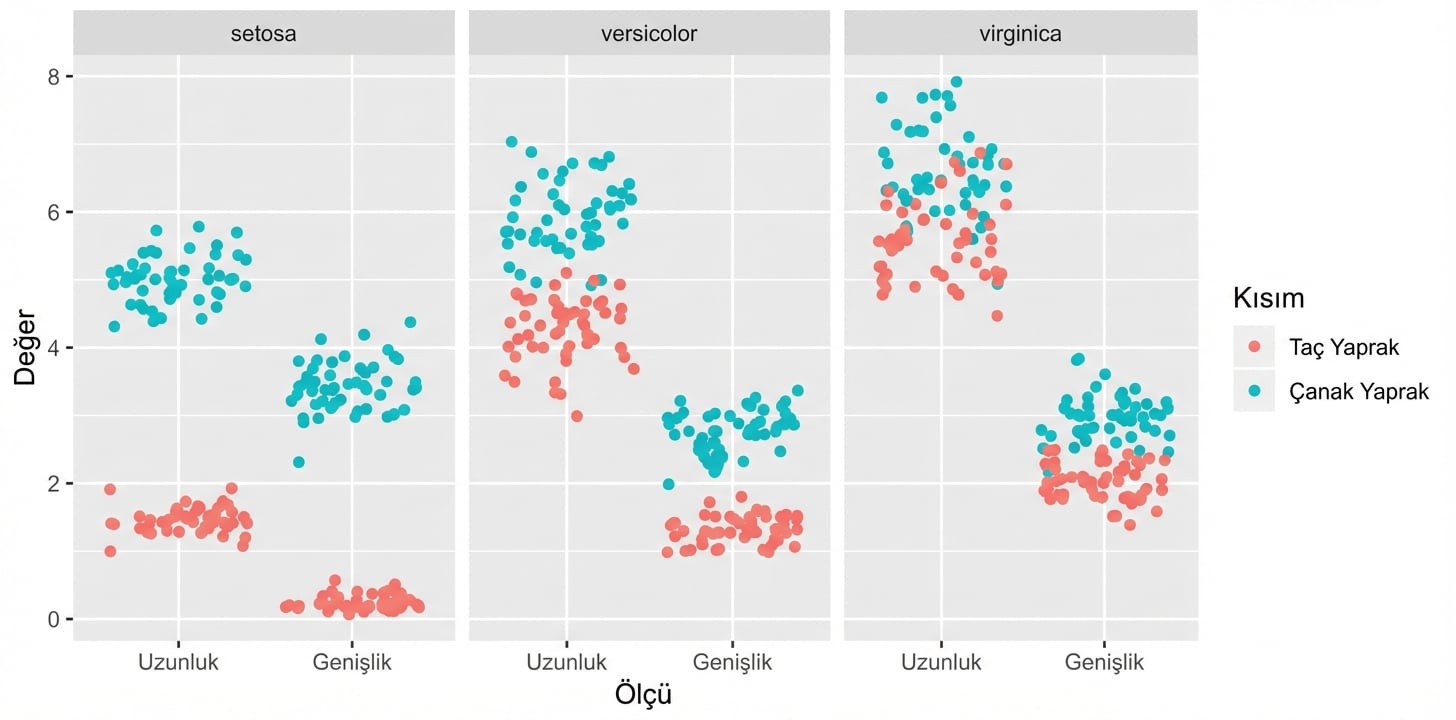
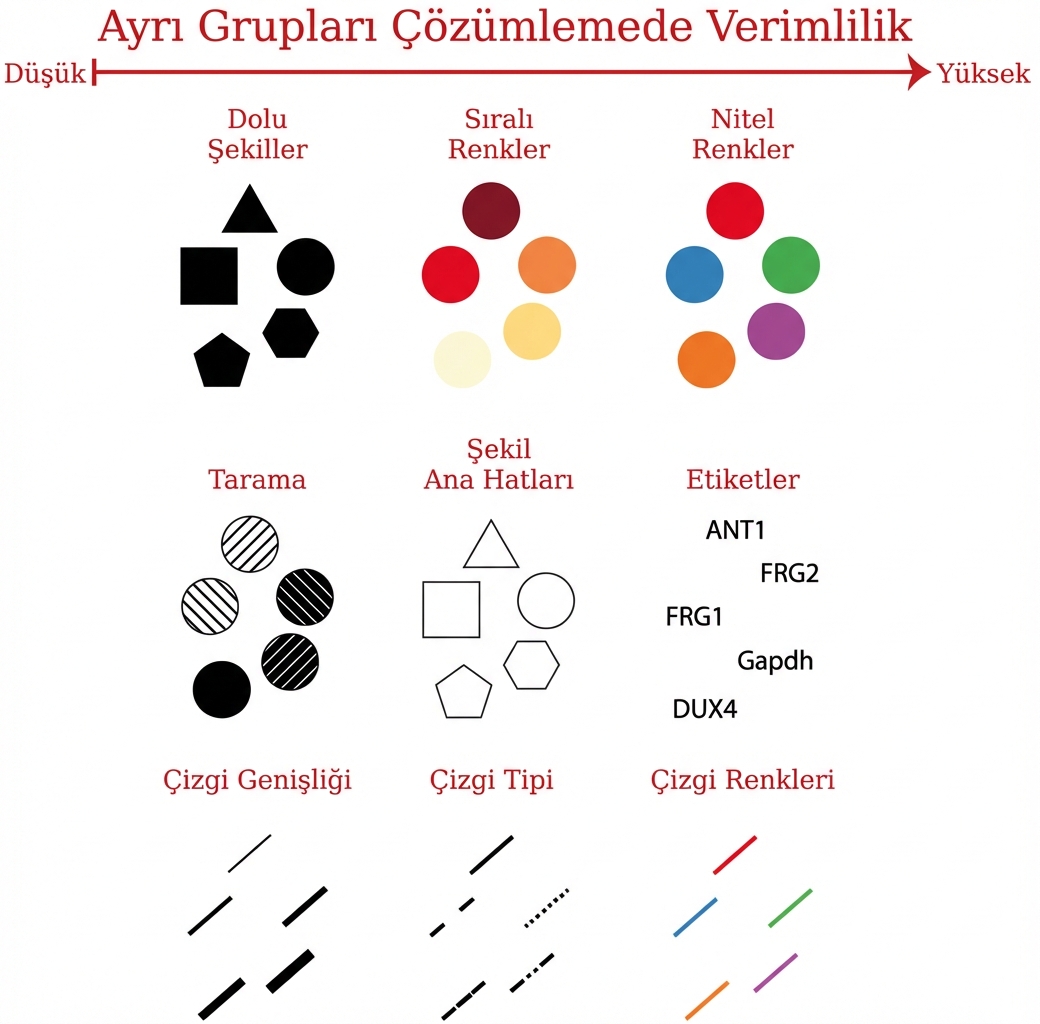
Estetik - kategorik değişkenler
Estetik - kategorik değişkenler