Histogramlar
ggplot2 ile Veri Görselleştirmeye Giriş

Rick Scavetta
Founder, Scavetta Academy
Histogramlar
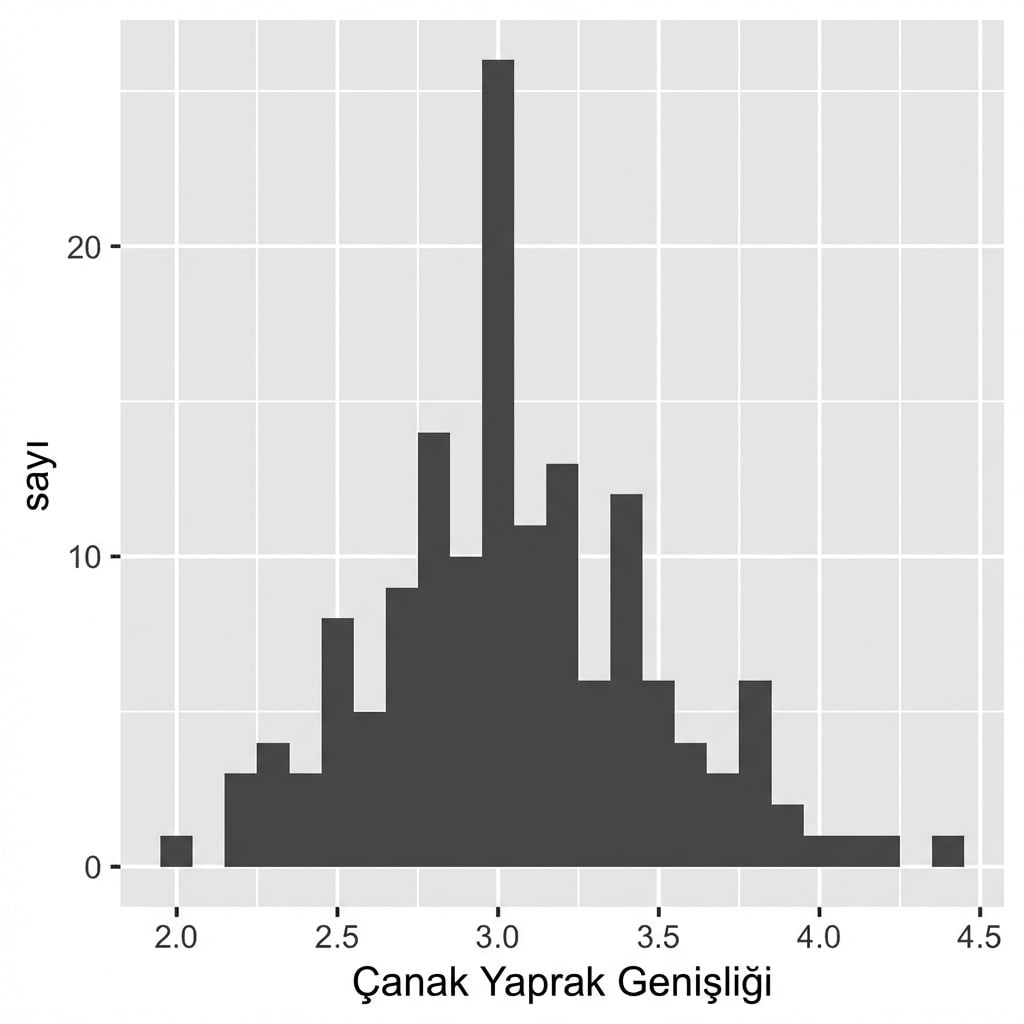
Varsayılan: 30 eşit bin
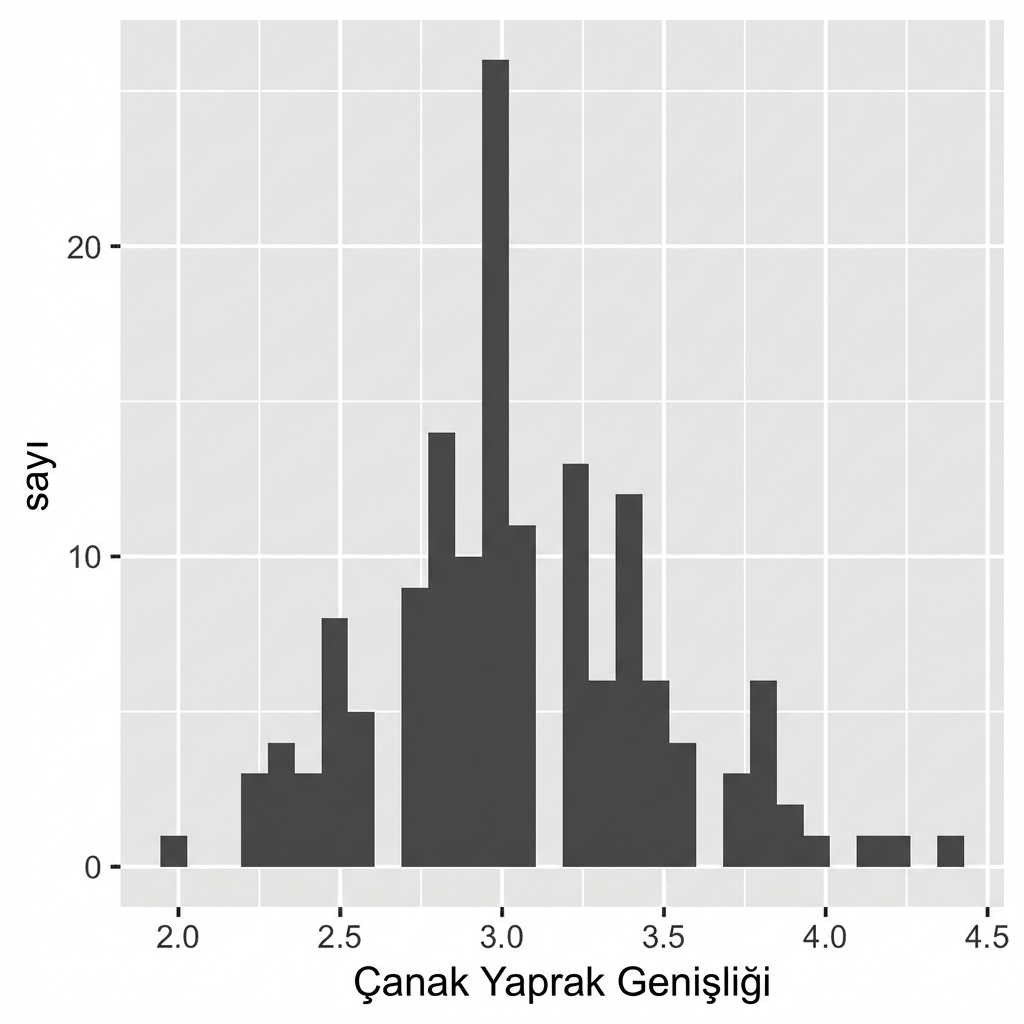
Sezgisel ve anlamlı bin genişlikleri
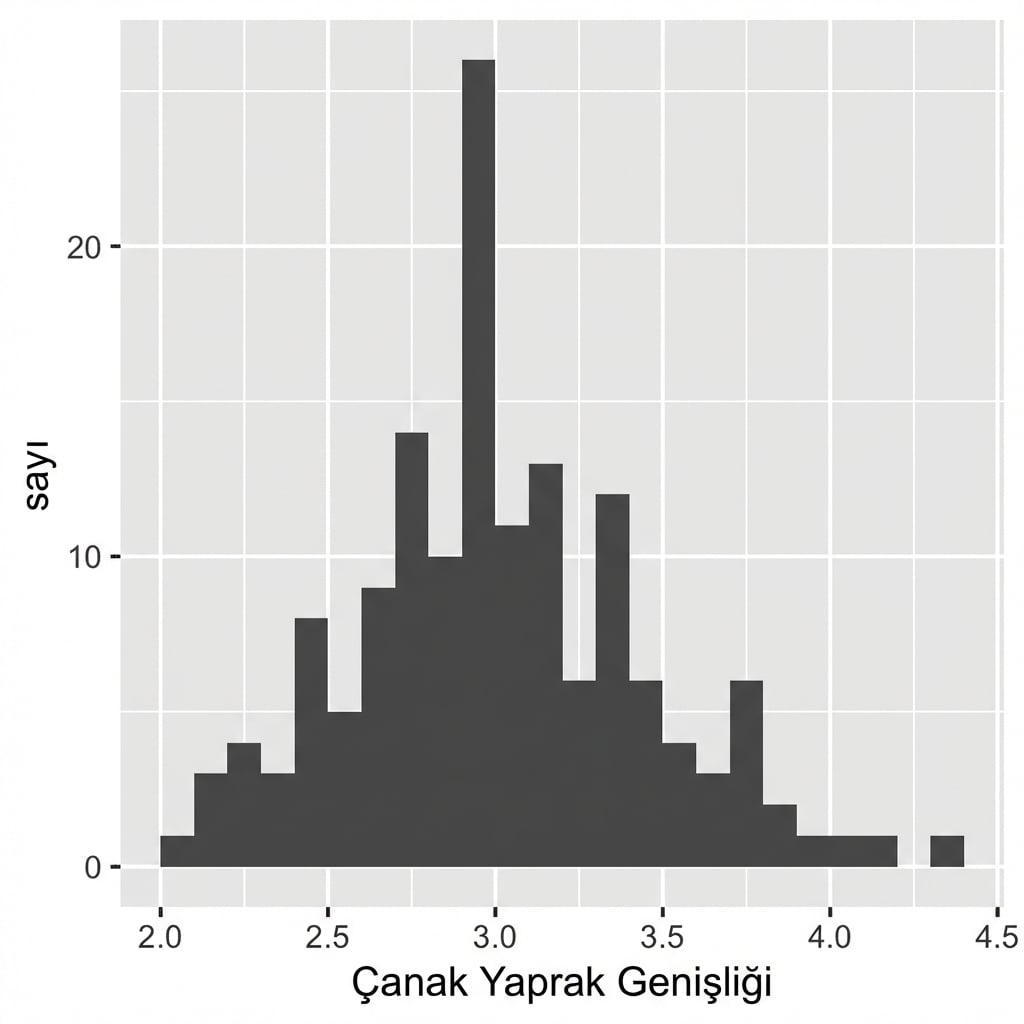
İşaret aralıklarını yeniden konumlandırma
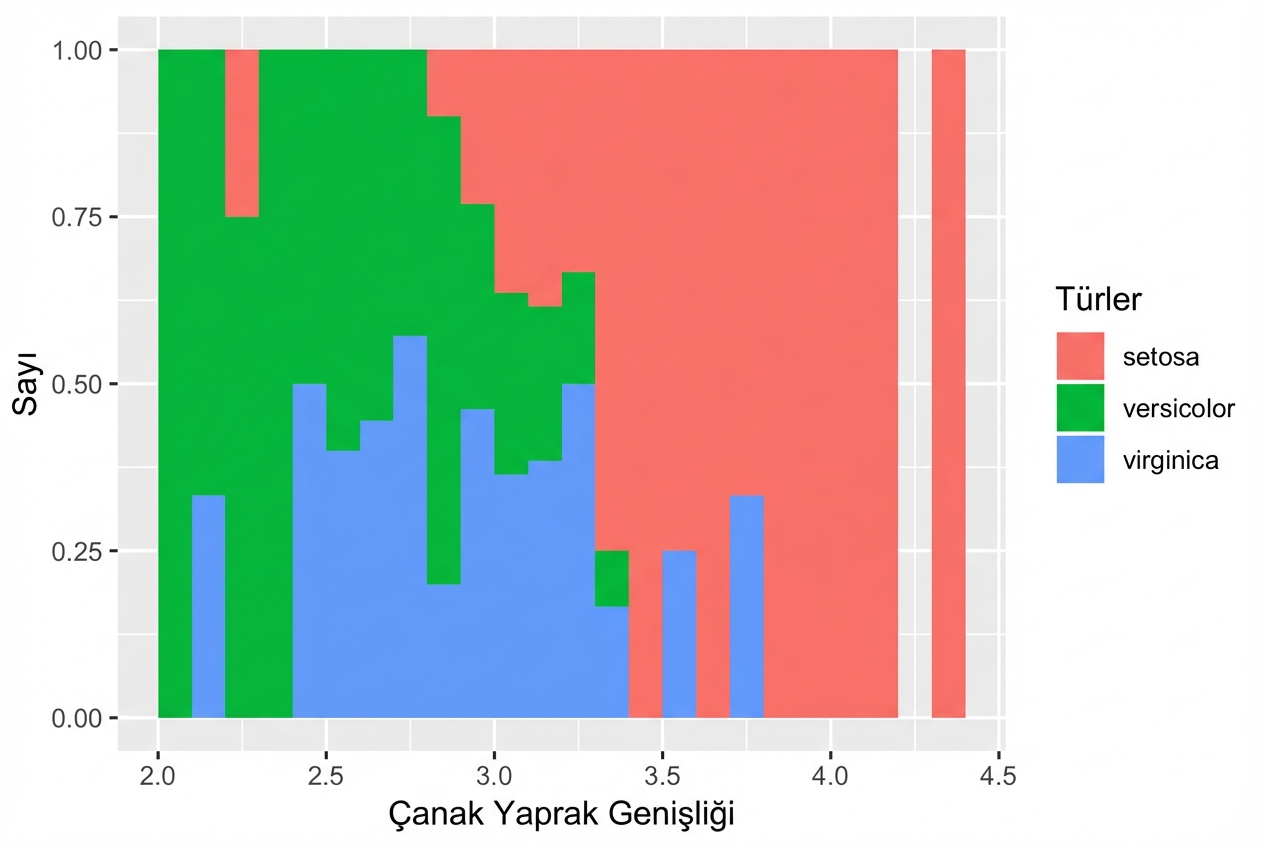
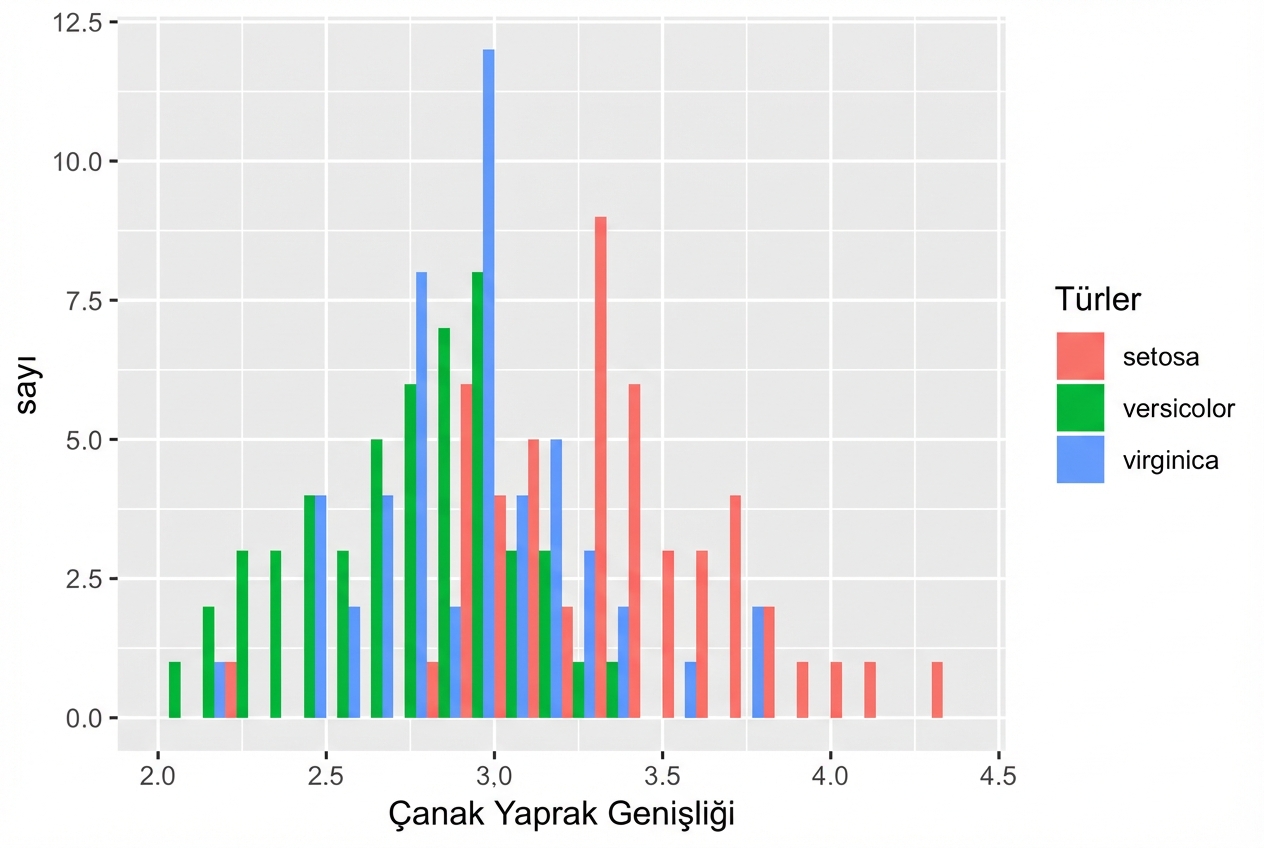
Farklı Türler
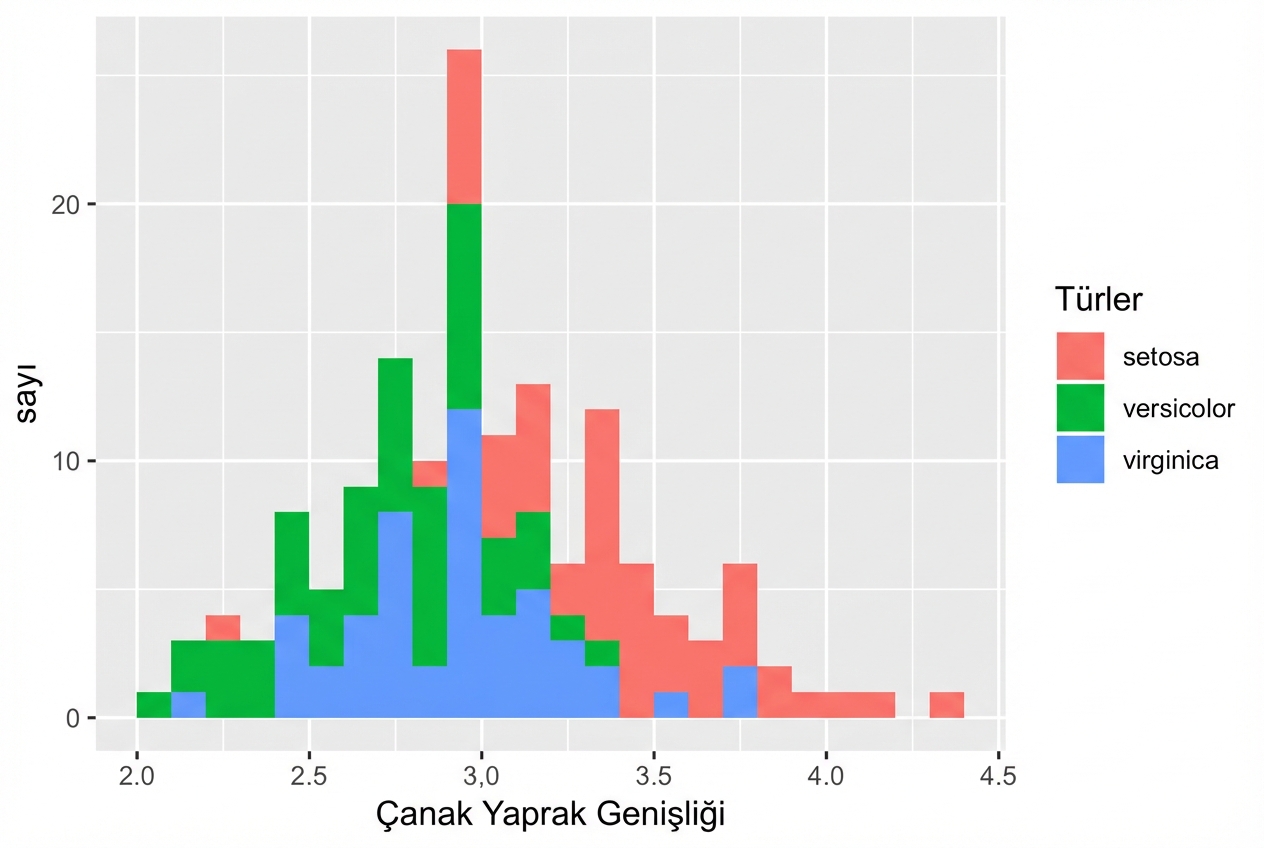
Varsayılan konum: "stack"
position = "dodge"
position = "fill"