Şekillerinizi başkalarıyla paylaşmaya hazırlama
Matplotlib ile Veri Görselleştirmeye Giriş

Ariel Rokem
Data Scientist
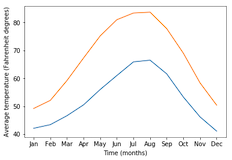
Grafik stilini değiştirme
import matplotlib.pyplot as plt
fig, ax = plt.subplots()
ax.plot(seattle_weather["MONTH"], seattle_weather["MLY-TAVG-NORMAL"])
ax.plot(austin_weather["MONTH"], austin_weather["MLY-TAVG-NORMAL"])
ax.set_xlabel("Zaman (ay)")
ax.set_ylabel("Ortalama sıcaklık (Fahrenheit derece)")
plt.show()
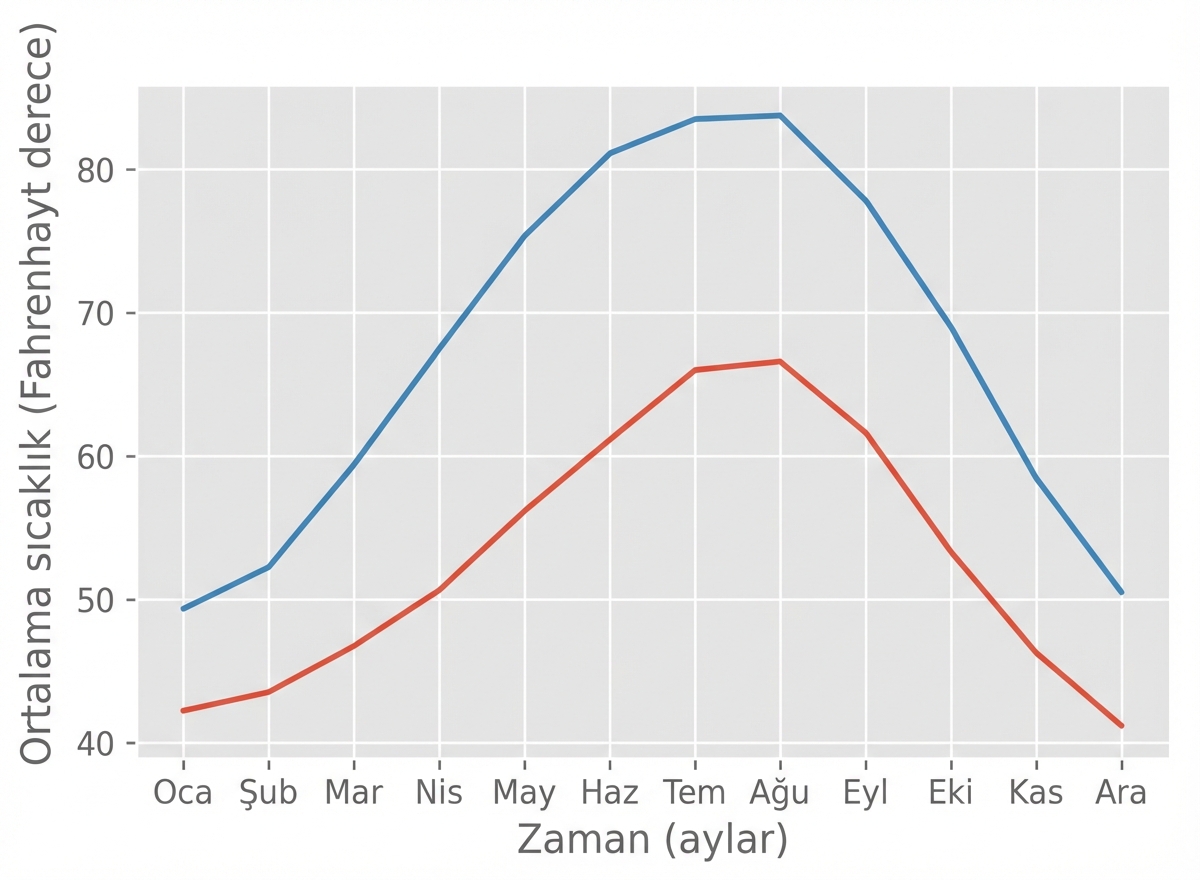
Bir stil seçme
plt.style.use("ggplot")fig, ax = plt.subplots() ax.plot(seattle_weather["MONTH"], seattle_weather["MLY-TAVG-NORMAL"]) ax.plot(austin_weather["MONTH"], austin_weather["MLY-TAVG-NORMAL"]) ax.set_xlabel("Zaman (ay)") ax.set_ylabel("Ortalama sıcaklık (Fahrenheit derece)") plt.show()
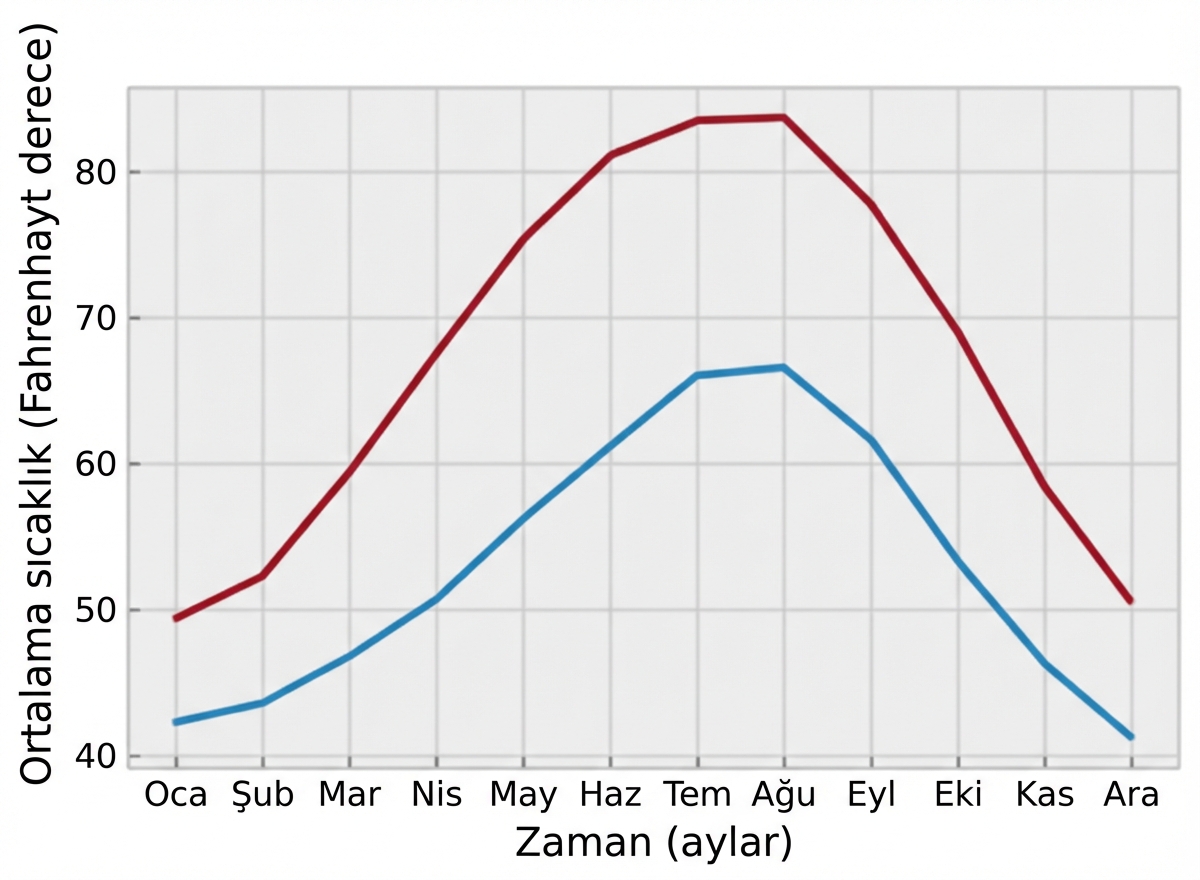
"bmh" stili
plt.style.use("bmh")fig, ax = plt.subplots() ax.plot(seattle_weather["MONTH"], seattle_weather["MLY-TAVG-NORMAL"]) ax.plot(austin_weather["MONTH"], austin_weather["MLY-TAVG-NORMAL"]) ax.set_xlabel("Zaman (ay)") ax.set_ylabel("Ortalama sıcaklık (Fahrenheit derece)") plt.show()
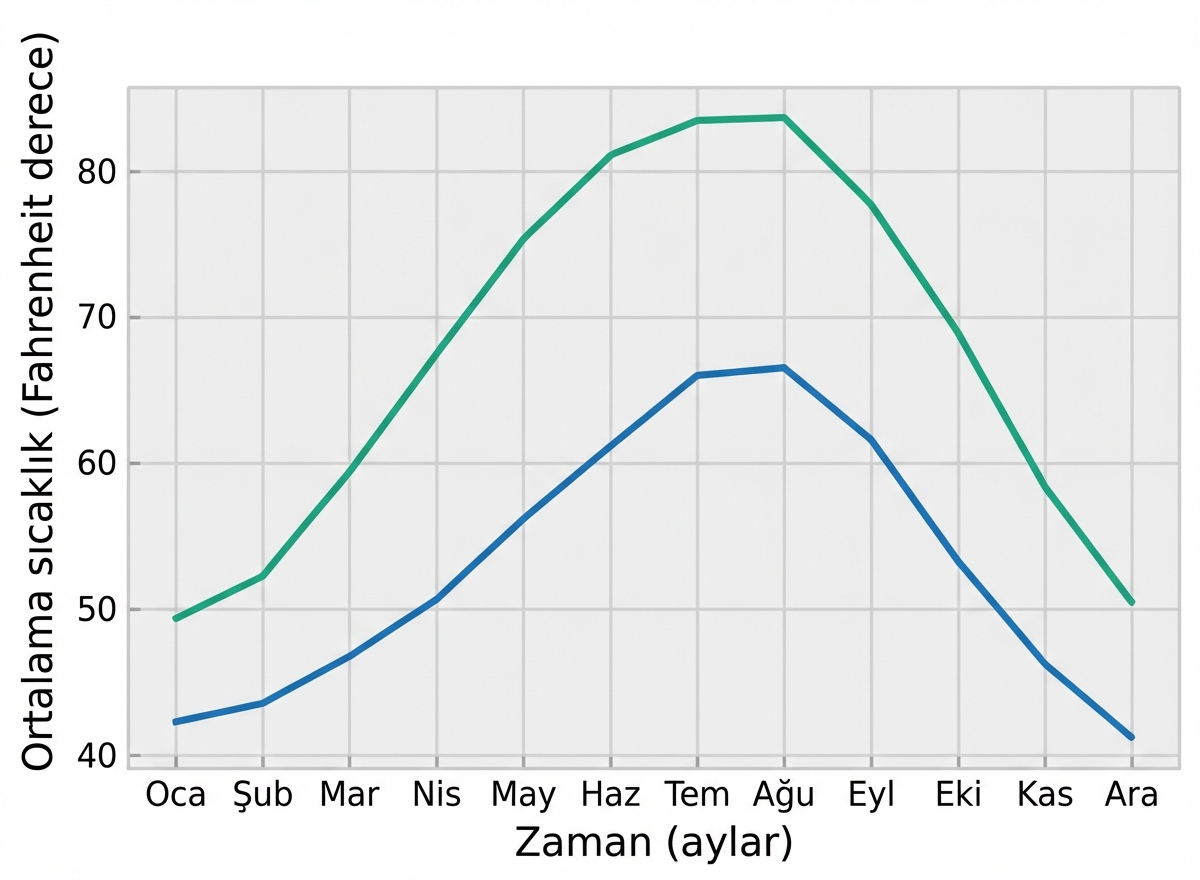
Seaborn stilleri
plt.style.use("seaborn-colorblind")fig, ax = plt.subplots() ax.plot(seattle_weather["MONTH"], seattle_weather["MLY-TAVG-NORMAL"]) ax.plot(austin_weather["MONTH"], austin_weather["MLY-TAVG-NORMAL"]) ax.set_xlabel("Zaman (ay)") ax.set_ylabel("Ortalama sıcaklık (Fahrenheit derece)") plt.show()