Nicel karşılaştırmalar: çubuk grafikleri

Matplotlib ile Veri Görselleştirmeye Giriş

Ariel Rokem

Data Scientist

Olimpik madalyalar

,Gold, Silver, Bronze
United States, 137, 52, 67
Germany, 47, 43, 67
Great Britain, 64, 55, 26
Russia, 50, 28, 35
China, 44, 30, 35
France, 20, 55, 21
Australia, 23, 34, 25
Italy, 8, 38, 24
Canada, 4, 4, 61
Japan, 17, 13, 34
Matplotlib ile Veri Görselleştirmeye Giriş

Olimpik madalyalar: veriyi görselleştirme

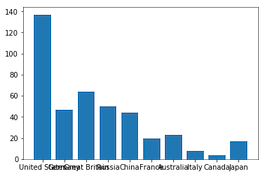
medals = pd.read_csv('medals_by_country_2016.csv', index_col=0)

fig, ax = plt.subplots()
ax.bar(medals.index, medals["Gold"]) plt.show()

Matplotlib ile Veri Görselleştirmeye Giriş

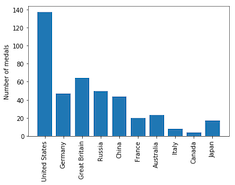
Ara: kene etiketlerini döndürme

fig, ax = plt.subplots()
ax.bar(medals.index, medals["Gold"])

ax.set_xticklabels(medals.index, rotation=90) ax.set_ylabel("Number of medals")
plt.show()

Matplotlib ile Veri Görselleştirmeye Giriş

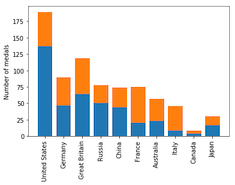
Olimpik madalyalar: diğer madalyaları görselleştirme

fig, ax = plt.subplots
ax.bar(medals.index, medals["Gold"])

ax.bar(medals.index, medals["Silver"], bottom=medals["Gold"])
ax.set_xticklabels(medals.index, rotation=90) ax.set_ylabel("Number of medals") plt.show()

Matplotlib ile Veri Görselleştirmeye Giriş

Olimpik madalyalar: üçünü birden görselleştirme

fig, ax = plt.subplots
ax.bar(medals.index, medals["Gold"])

ax.bar(medals.index, medals["Silver"], bottom=medals["Gold"])

ax.bar(medals.index, medals["Bronze"], bottom=medals["Gold"] + medals["Silver"])
ax.set_xticklabels(medals.index, rotation=90) ax.set_ylabel("Number of medals") plt.show()
Matplotlib ile Veri Görselleştirmeye Giriş

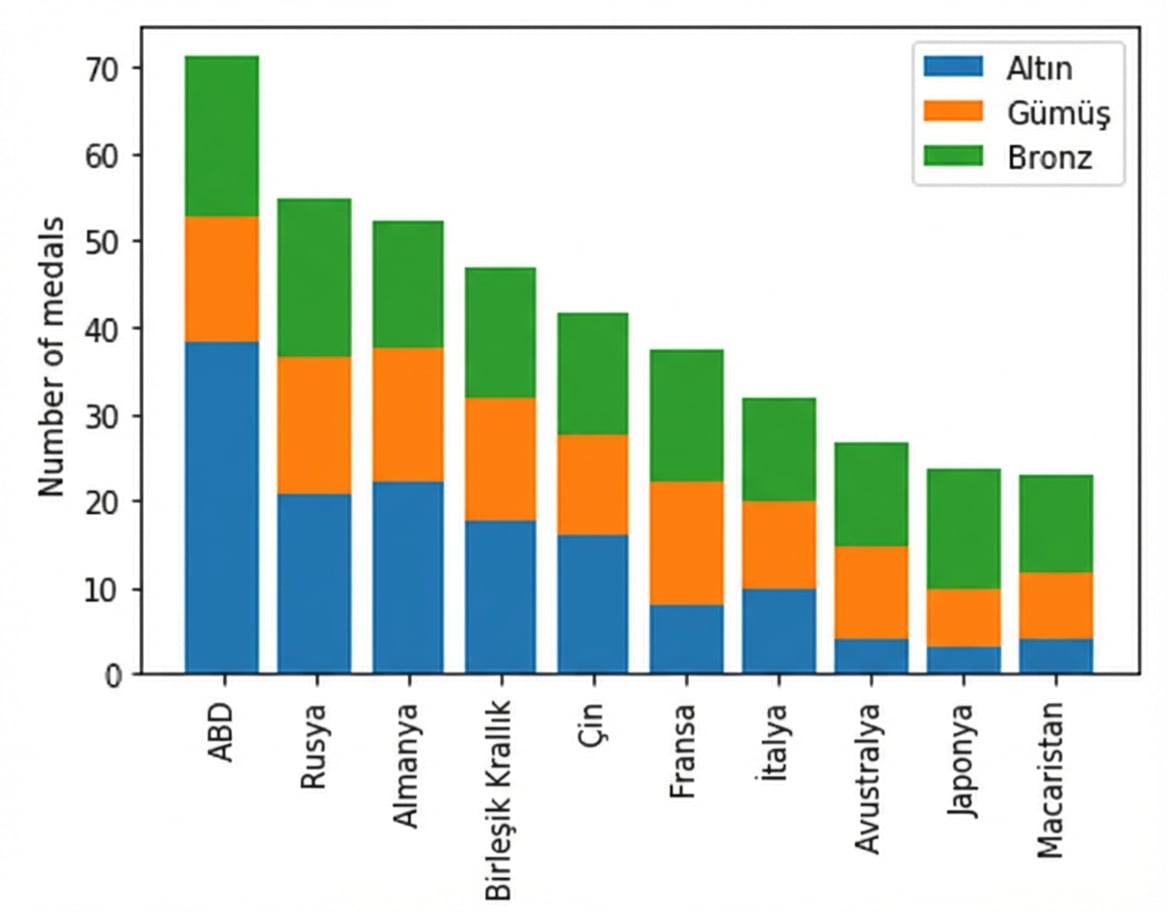
Yığılmış çubuk grafik

Matplotlib ile Veri Görselleştirmeye Giriş

Gösterge ekleme

fig, ax = plt.subplots
ax.bar(medals.index, medals["Gold"])
ax.bar(medals.index, medals["Silver"], bottom=medals["Gold"])
ax.bar(medals.index, medals["Bronze"],
       bottom=medals["Gold"] + medals["Silver"])

ax.set_xticklabels(medals.index, rotation=90)
ax.set_ylabel("Number of medals")
Matplotlib ile Veri Görselleştirmeye Giriş

Gösterge ekleme

fig, ax = plt.subplots
ax.bar(medals.index, medals["Gold"], label="Gold")
ax.bar(medals.index, medals["Silver"], bottom=medals["Gold"], 
       label="Silver")
ax.bar(medals.index, medals["Bronze"],
       bottom=medals["Gold"] + medals["Silver"], 
       label="Bronze")

ax.set_xticklabels(medals.index, rotation=90)
ax.set_ylabel("Number of medals")

ax.legend() plt.show()
Matplotlib ile Veri Görselleştirmeye Giriş

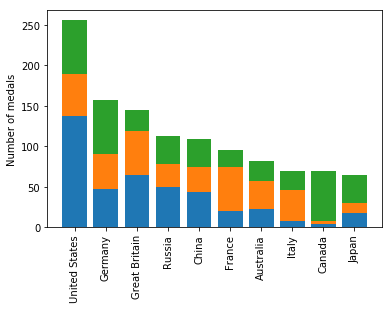
Göstergeyle yığılmış çubuk grafik

Matplotlib ile Veri Görselleştirmeye Giriş

Bir çubuk grafik oluşturun!

Matplotlib ile Veri Görselleştirmeye Giriş

Preparing Video For Download...